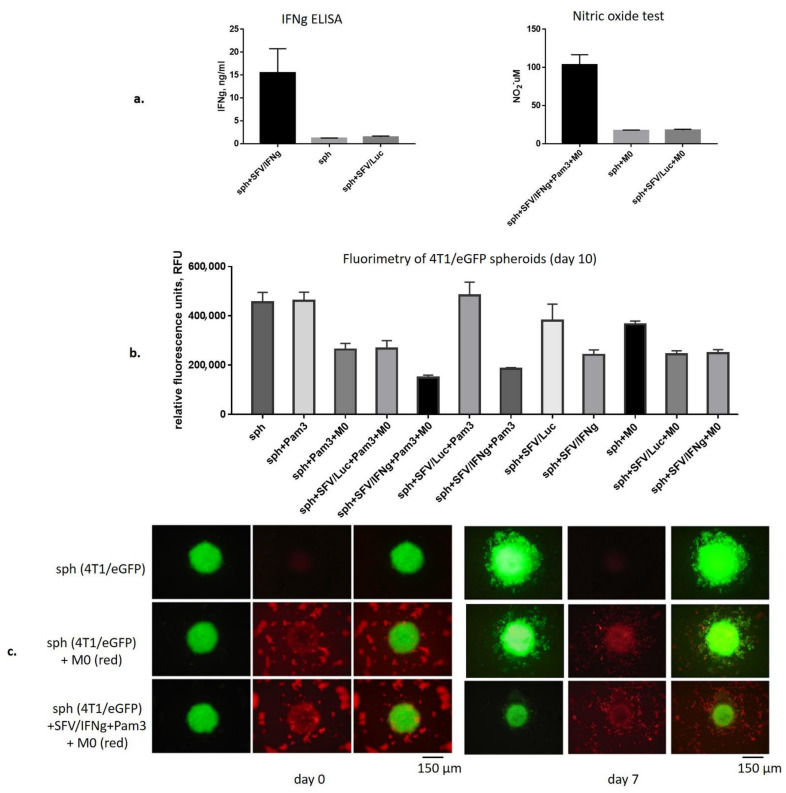
Figure 3.
Coculturing of SFV/IFNg-infected 4T1/eGFP spheroids with macrophages. Single 4T1/eGFP spheroids were generated from 3000 cells in 96-well ultralow attachment plates. The next day, the spheroids were infected with either SFV/IFNg or SFV/Luc (5 × 10⁴ i.u./well) or incubated with PBS as the uninfected control. The next day after infection, BMDMs (3 × 10⁴ cells/well) were added to the spheroids (+M0, day 0). In total, twelve combination groups (six single spheroids in each group, n = 6) were prepared: sph—uninfected spheroids (PBS); sph+Pam3; sph+Pam3+M0; sph+SFV/Luc+Pam3+M0; sph+SFV/IFNg+Pam3+M0; sph+SFV/Luc+Pam3; sph+SFV/IFNg+Pam3; sph+SFV/Luc; sph+SFV/IFNg; sph+M0; sph+SFV/Luc+M0; sph+SFV/IFNg+M0. Pam3 was added to a final concentration of 100ng/mL to respective groups. (a) The production of vdIFNg by spheroids was measured in cell culture supernatants by ELISAs 18 h after infection, before the macrophages were added. The production of NO by macrophages was measured in cell culture supernatants after two days of incubation with infected spheroids. (b) The total eGFP fluorescence measured by fluorimetry at day 10 of the incubation. (c) Representative fluorescence microscopy images of spheroids incubated with prestained macrophages (red) at day 0 and day 7. Bars represent the mean values ± SD, n = 6.

