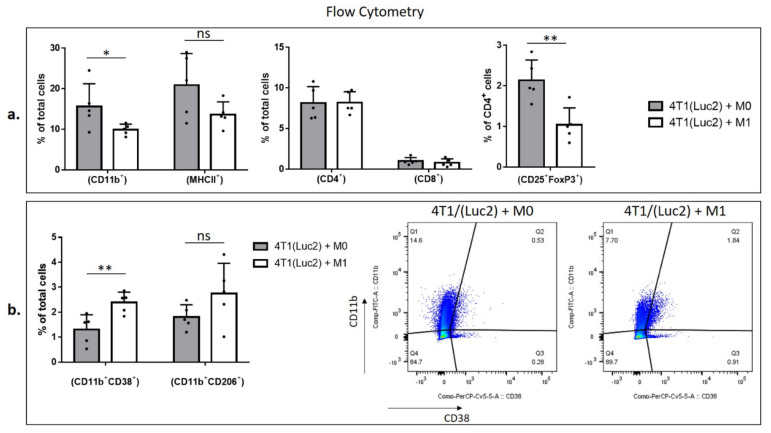
Figure 5.
Flow cytometry analysis of immune cells isolated from tumors generated by implantation of 4T1(Luc2) cells premixed with M0 or M1 macrophages. Tumors were homogenized and a single cell suspension was used for immunostaining (see Materials and methods for the details). Flow cytometry was performed to quantify the immune cell populations (%): (a) CD11b+; MHCII+; CD4+; CD8+ in total single cells and CD25+/FoxP3+ in the CD4+ population; and (b) double positive CD11b+/CD38+, CD11b+/CD206+ cells in total single cells. Representative flow cytometry gating data of CD11b+ and CD38+ cells are shown. Bars represent the means ± SD (n = 5); * p < 0.05; ** p < 0.01; ns—nonsignificant.

