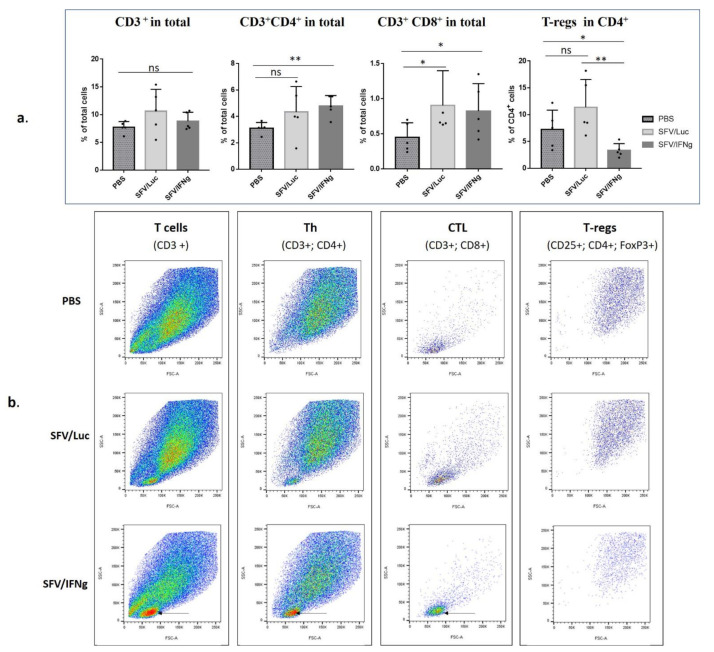
Figure 8.
Flow cytometry analysis of T cells in the tumors treated with SFV/IFNg, SFV/Luc, or PBS in orthotopic 4T1 mouse breast cancer model (mice were treated as presented in Figure 6d). Resected tumors were homogenized to obtain a single cell suspension, which was used for immunostaining with antibodies against surface markers (CD3, CD4, CD8, CD25) and intracellular markers (FoxP3) in one mixture. (a) Percentages of cell populations. Th cells were identified as CD3+/CD4+; CTL cells as CD3+/CD8+, and T-regs as CD4+/CD25+/FoxP3+ populations. (b) Representative pictures of forward and side (SSC-A/FSC-A) scattering of the cell populations. Arrows indicate the increased population of lymphocytes in the SFV/IFNg group. Bars represent the means ± SD (n = 5); * p < 0.05; ** p < 0.01; ns—nonsignificant.

