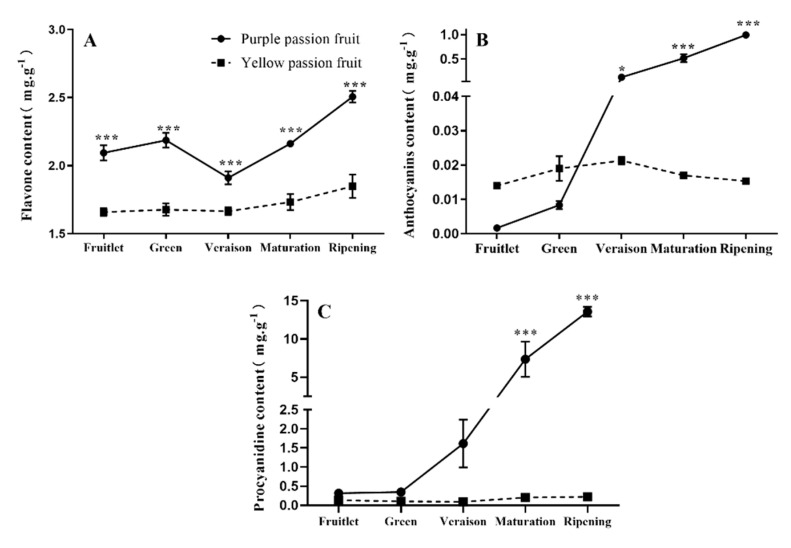
Figure 1.
Changes in contents of total flavonoids (A), anthocyanin (B), and procyanidins (C) in the peel of purple and yellow passion fruit during fruit development. Vertical bars indicate means ± SD (n = 3, 5 fruits per replicate). The * and *** represent significance at p ≤ 0.05 and p ≤ 0.001, respectively, among both cultivars according to Student’s t-test.

