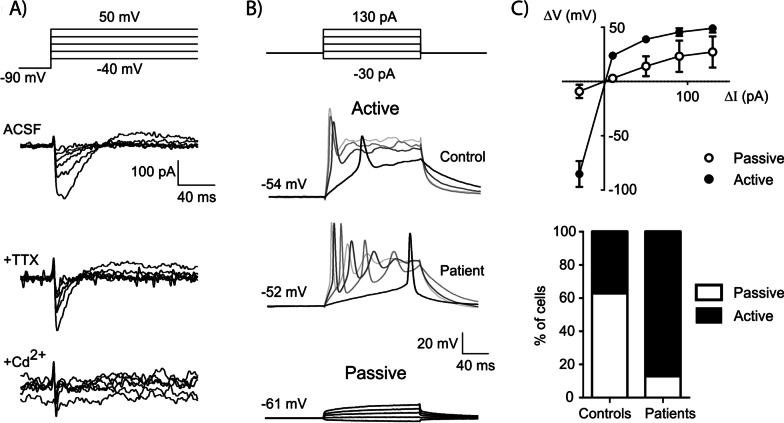
Fig. 3.
Representative voltage clamp recordings of a cell from NE a NE cells display fast inward currents with sensitivity to TTX (10 µM) and cadmium (100 µM) when subjected to the series of voltage steps schematized above. b representative current clamp recordings of two active cells recorded from control and patient NE as indicated, and a passive cell recorded from control NE, in response to the series of current steps schematized above (12 weeks in culture). c The top graph shows average voltage vs. current curves for passive and active cells from control NE. The bottom graph shows the percentage of active and passive cells found in NE of control and patients at 12 weeks in culture. Significantly different, Chi Square (p < 0.04, number of observations: 8 cells/group)

