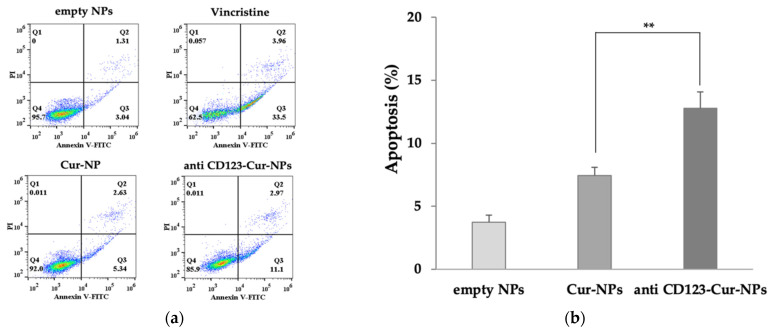
Figure 7.
Apoptosis assay using flow cytometry after staining with double annexin V-FITC/propidium iodide (PI). KG-1a cells were treated with empty NPs, Cur-NPs, and anti-CD123-Cur-NPs. (a) Representative flow cytometry dot plot indicating the cell population in apoptotic and necrotic quadrants after treatment with different NPs. (b) The percentage of apoptotic cells was statistically compared. The data are shown as mean ± SD from three independent experiments. ** p < 0.05 between groups.

