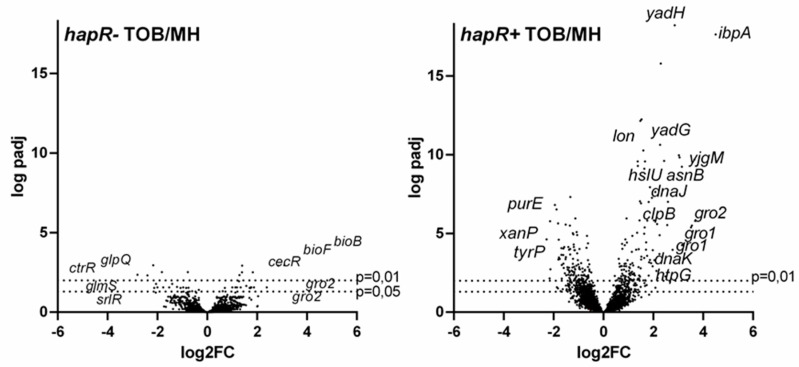
Figure 2.
Transcriptomic profiles of V. cholerae cells treated with subMIC TOB depend on HapR proficiency. Volcano plots depicting gene expression changes caused by subMIC TOB (2% MIC) in HapR deficient (left panel) or HapR proficient (right panel) V. cholerae cells. The names of the genes with the strongest fold changes are represented. The x-axis represents the log2 of the fold change plotted against the log10 of the adjusted p-value.

