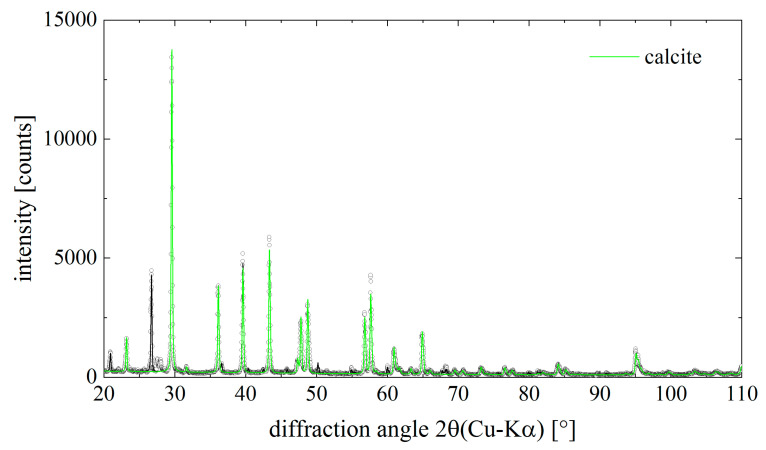
Figure 6.
Diffraction pattern of the mineral phase isolated from chitinous skeletal fibers of I. basta demosponge. Dots are measured data points, the solid lines result from a Rietveld- (Pawley)-fit of the data. The contribution of calcite to the total diffraction pattern is highlighted in green color. Calcite is the main component in the sample.

