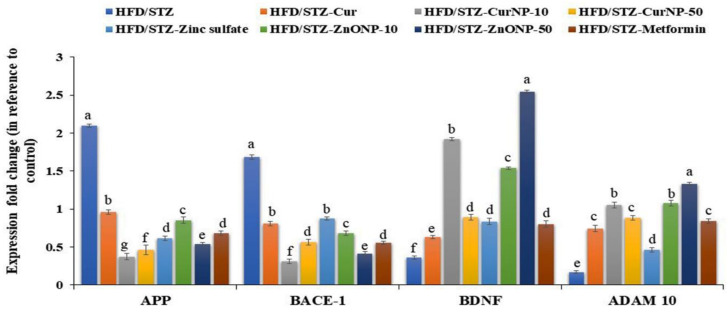
Figure 3.
Gene expression profile of APP, BACE-1, BDNF, and ADAM-10 in the hippocampus of rats. Data are expressed as mean ± SEM (n = 3); means for the same parameter with different letters (a–g) in each bar are significantly different (p < 0.01), the largest data value takes the letter (a) and the smallest data value takes the letter (g).

