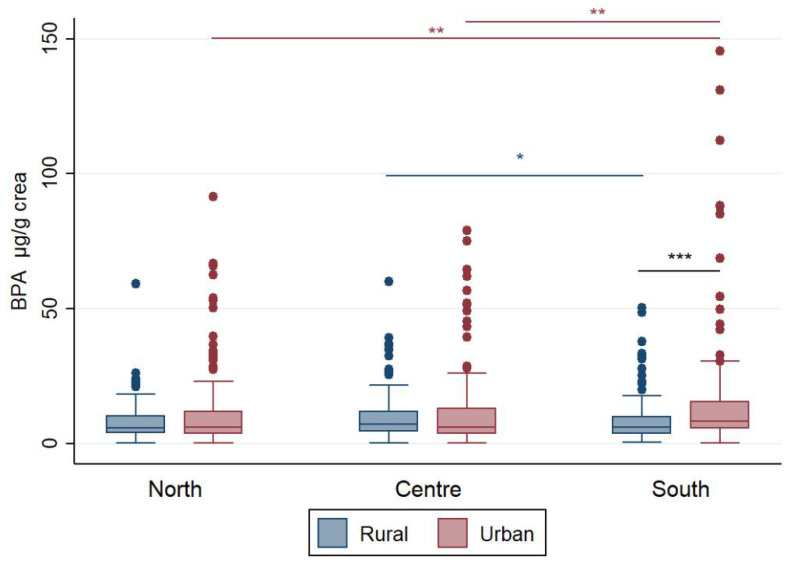
Figure 1.
Box plots for BPA levels in urine samples of Italian children stratified by macro-area and area and normalized to urine creatinine content (µg/g). Outliers above 150 µg/g were excluded from the graph to improve box plot visibility. Asterisks indicate the level of significance: * p < 0.05, ** p < 0.01, *** p < 0.001.

