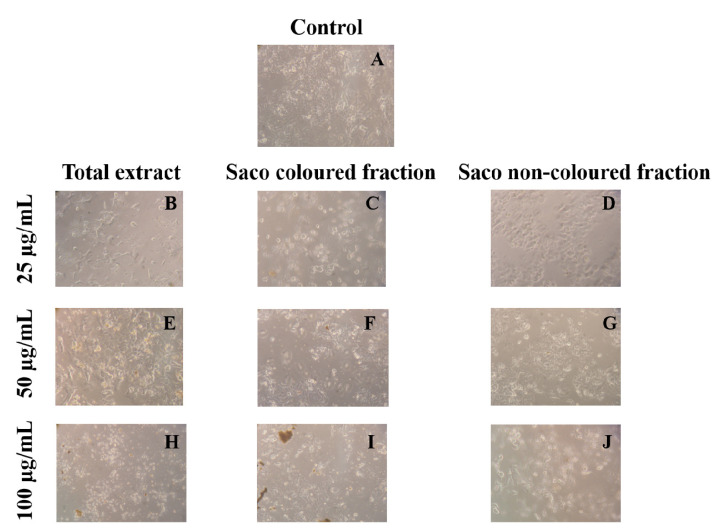
Figure 3.
Morphological changes in HepG2 cells (control vs. treatment after 72 h of incubation). (A) corresponds to the control, (B,E,H) correspond to Saco total extract, while (C,F,I) to the coloured fraction and (D,G,J) to the non-coloured one, at concentrations of 25, 50 and 100 µg/mL, respectively.

