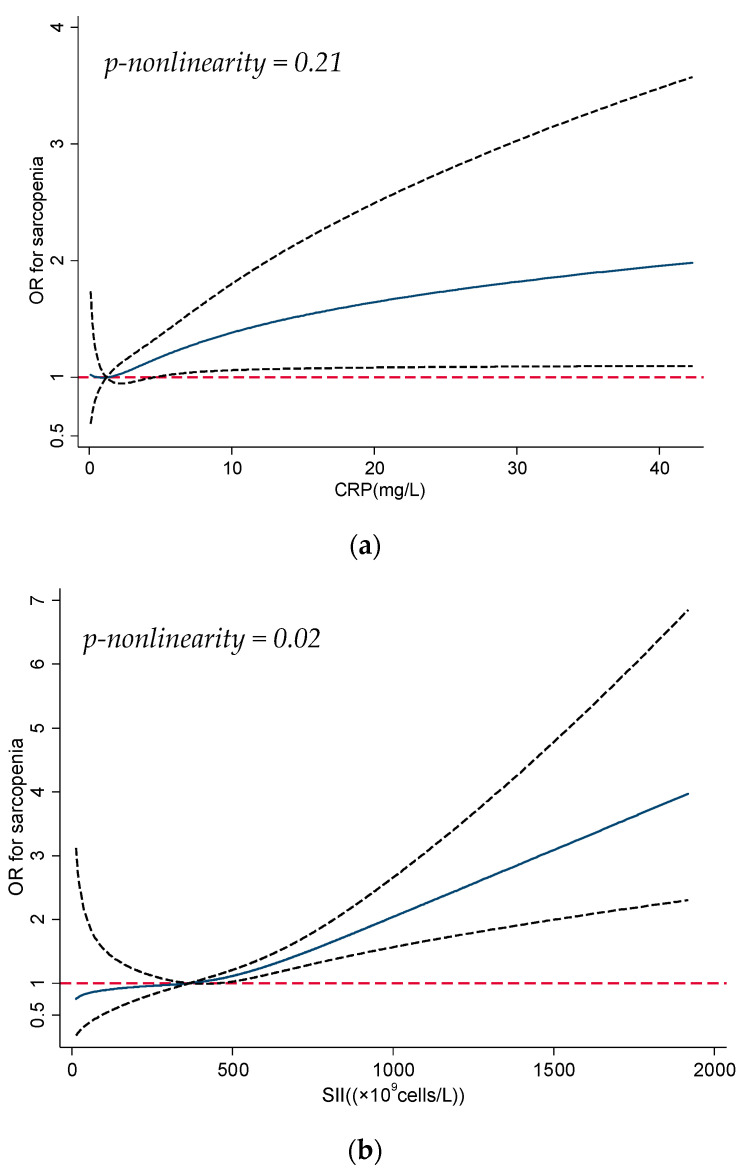
Figure 1.
(a) Dose–response curve for association between CRP and sarcopenia; the solid line shows the odds ratios (ORs), and the dotted line represents the 95% confidence intervals. CRP = 1.2 mg/L was used as the reference in the curve. Abbreviations—CRP: C-reactive protein. (b) Dose–response curve for association between SII and sarcopenia; the solid line shows the odds ratios (ORs), and the dotted line represents the 95% confidence intervals. SII = 365.7 × 10⁹ cells/L was used as the reference in the curve. Abbreviations—SII: systemic immune-inflammation index.

