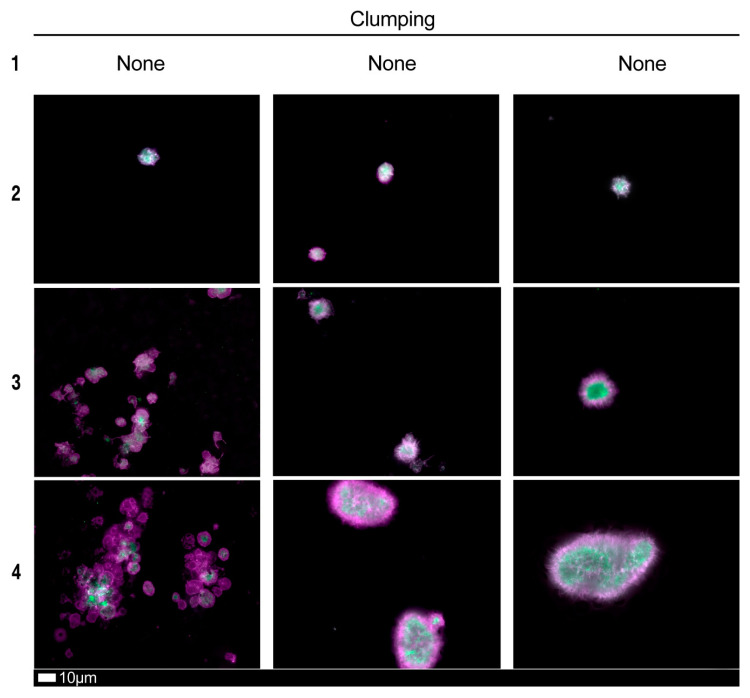
Figure 6.
Fluorescence microscopy examples of the different stages of platelet clumping. With no clumping occurring in the healthy/control samples in Stage 1 (no figures shown), progressing to severe clumping of platelets as seen in Stage 4. Stage 1 to 4 is also used as a numerical scoring system, where a score of 1 is given for no clumping and a score of 4 is given for severe clumping.

