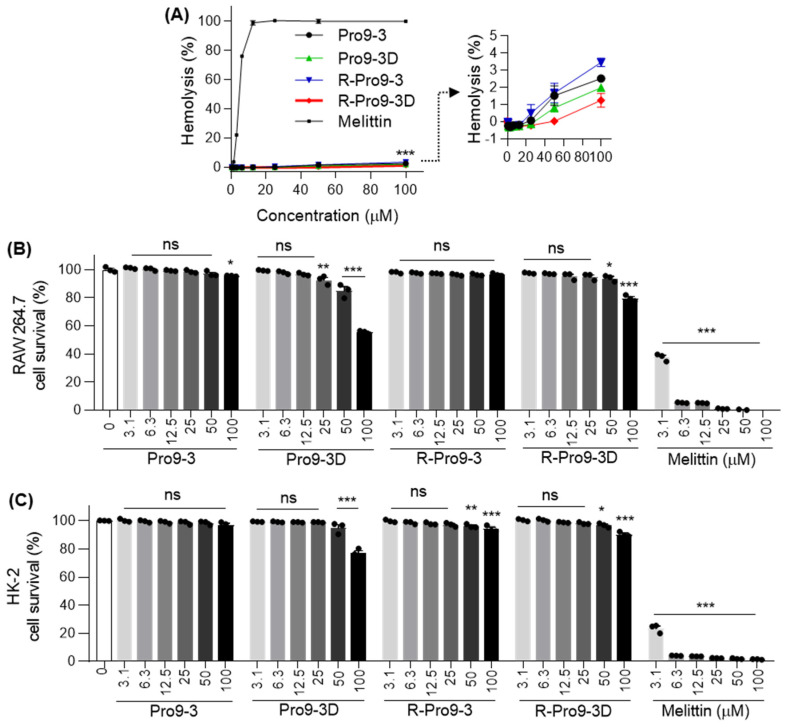
Figure 6.
In vitro cytotoxicity of Pro9-3 and their analogues. (A) Dose-response curve represent the hemolytic activity of peptides against sheep red blood cell (sRBC). Concentration-dependent (0–100 μM) toxic effects induced by peptides on (B) RAW 264.7 murine macrophage cells and (C) human kidney (HK)-2 cells for 24 h. Melittin was used as a control. Statistical analysis was performed using two-way analysis of variance (ANOVA) with Dunnett’s comparison test. Values are expressed as mean ± SEM of three independent experiments. * p < 0.05, ** p < 0.01, *** p < 0.001, and ns, non-significant compared with the control.

