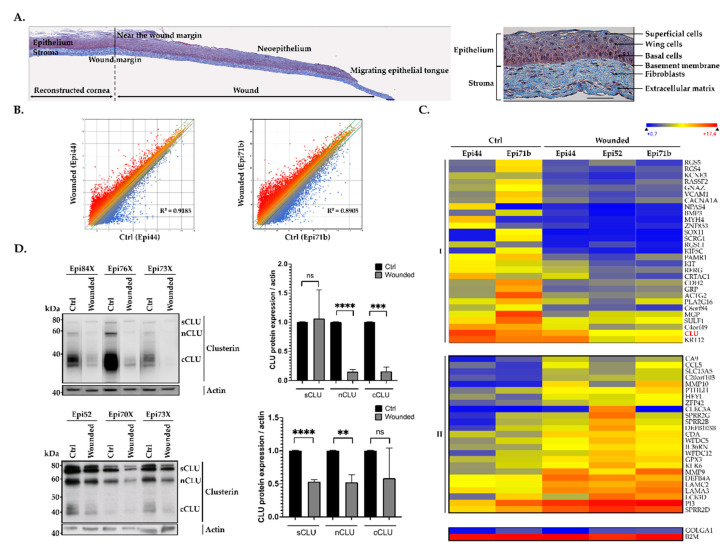
Figure 1.
Gene expression patterns in response to corneal damage. (A) Composite images showing a complete histological (Masson’s Trichrome staining cells are pink and collagen is blue) view of wounded HTECs (with Epi52) at 4 days following corneal damage (left panel) and unwounded hTECs as a control (right panel). The wound margin created by the biopsy punch and the various elements which composed hTECs are indicated. Scale bar: 50 μm. (B) Scatter plot of log2 of signal intensity from 60,000 different targets covering the entire human transcriptome of cells isolated from the central area of wounded hTECs (in the y-axis) plotted against cells from unwounded hTECs (in the x-axis) and assembled using either Epi44 (left panel) or Epi71b (right panel) hCECs. (C) Heatmap representation of the 54 most deregulated genes expressed by centrally wounded relative to unwounded (negative control) hTECs. The color scale used to display the log2 expression level values is determined by the Hierarchical clustering algorithm of the Euclidian metric distance between genes. Genes indicated in dark blue correspond to those whose expression is very low, whereas highly expressed genes are shown in orange/red. Microarray data for the housekeeping genes β2-microglobulin (B2M) and golgin subfamily A member 1 (GOLGA1) that are expressed respectively to very high and low levels in all types of cells are also shown. (D) Western blot (left panel) and quantification analysis (right panel) of CLU protein isoforms either in hTECs (top panel) or in human epithelial corneal cells (bottom panel). Actin is also shown as an internal control. **: Values considered to be statistically significant from those obtained with the control (Ctrl) protein extract (p value < 0.001). ***: Values statistically significant from those obtained with the control (Ctrl) protein extract (p value < 0.001). ****: Values statistically significant from those obtained with the control (Ctrl) protein extract (p value < 0.0001). ns: Values considered to be statistically non-significant.

