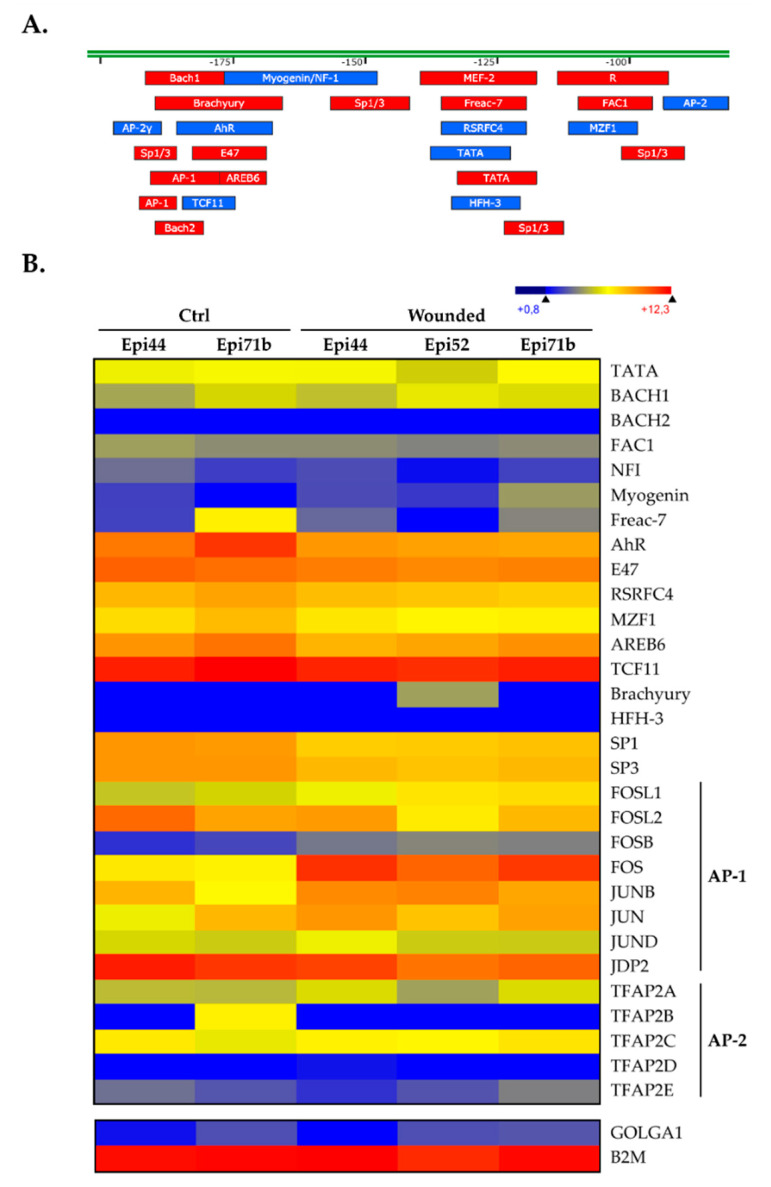
Figure 3.
Putative transcription factor binding sites along the CLU promoter sequence. (A) Schematic representation of the human CLU promoter -82/-203 segment along which the presumed transcription factor binding sites. TF target sites identified on the DNA top strand are indicated in red, whereas those indicated in blue are located on the bottom strand. (B) Heatmap representation of the transcriptional profiles of all the TFs expressed by hTECs for which a putative target site was identified in panel (A). Microarray data for B2M and GOLGA1 are also shown as controls.

