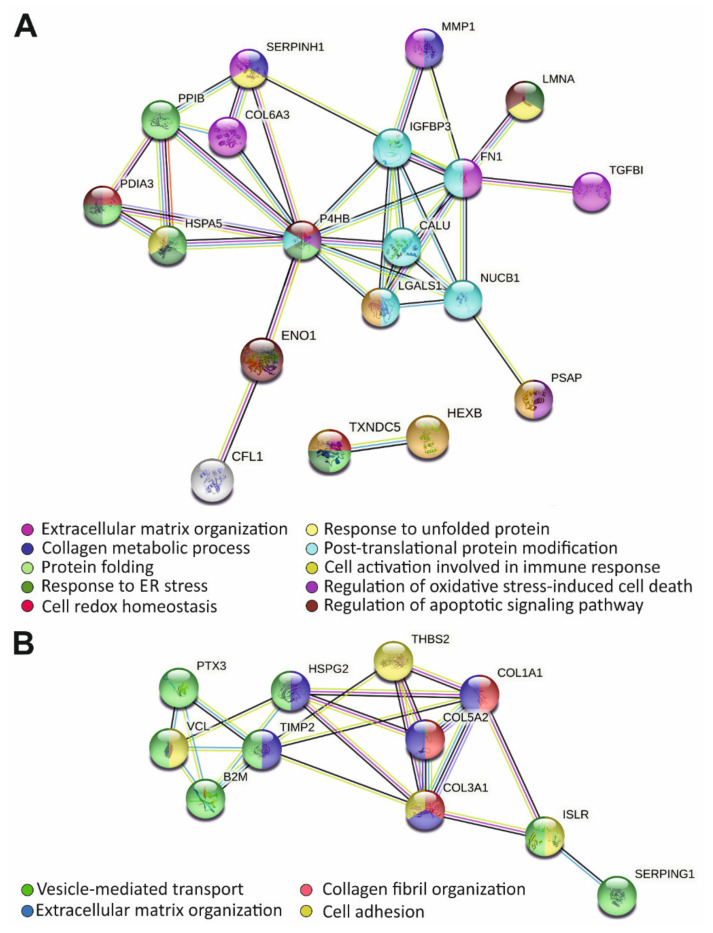
Figure 2.
STRING analysis uncovering protein-protein interactions of up- (A) and down-regulated (B) proteins identified in the secretome of hEDS cells. Each node represents a protein, and each edge represents an interaction including either physical or functional associations. Only interactions with the highest confidence score (0.9) are shown.

