Figure 4.
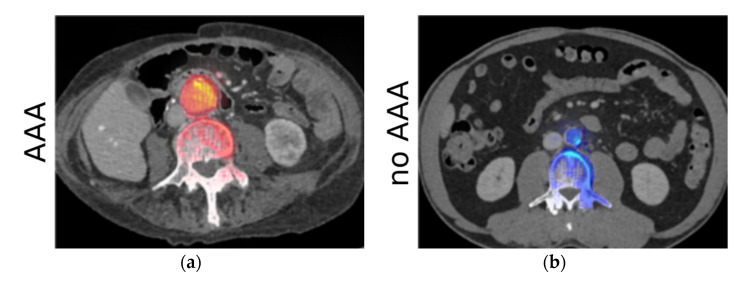
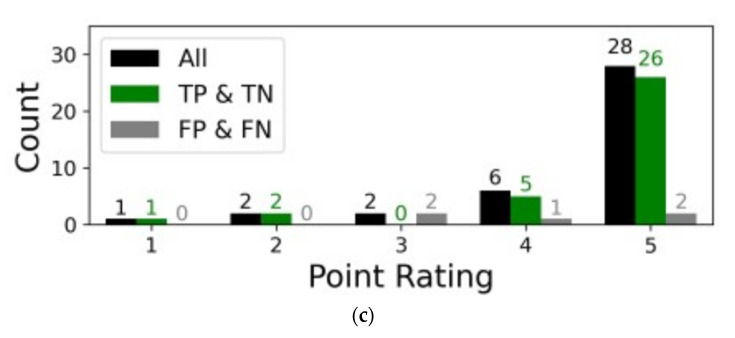
Experiment 2—results of the analysis using LRP. (a,b) show relevance maps for predicting the AAA super-imposed on the CT images for two example cases. (a) Shows a case with AAA, while (b) shows a case without AAA. Positive values are shown in red with high values in yellow, while negative values are shown in blue with high values as light blue. The high relevance around the aorta confirms that the networks correctly learned to make the classification decision based on the ROI. (c) Shows the score distribution of the assessment by an experienced radiologist.


