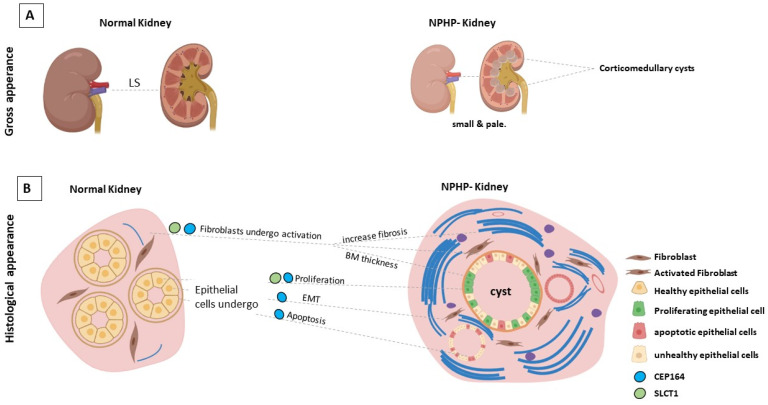
Figure 2.
(A). Longitudinal section of a diseased NPHP kidney compared with a section of a normal kidney. Cysts form at the corticomedullary junction. (B). Diagram depicting a cross section of the kidney, illustrating the multiple cellular stress changes associated with a SCLT1 and CEP164 deficiency during NPHP development. Image was created by BioRender.

