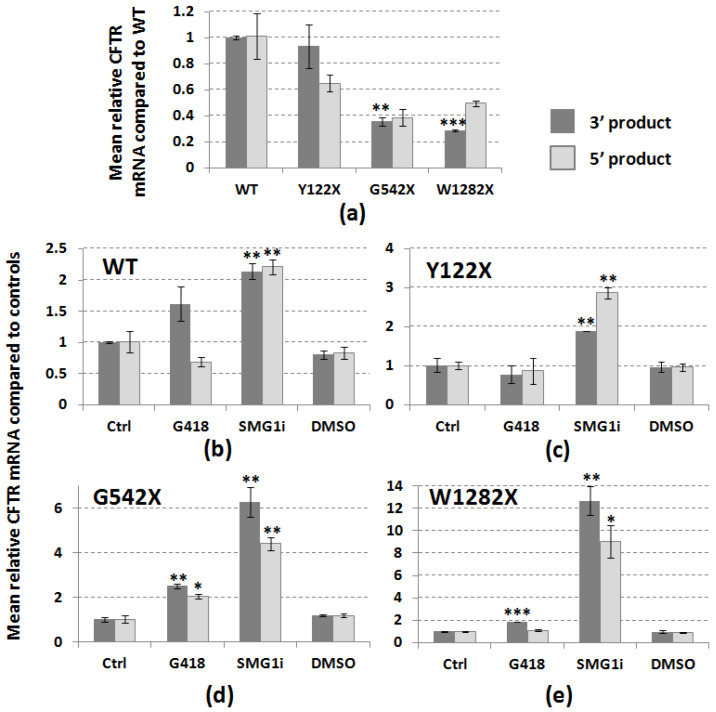
Figure 2.
Effect of PTC mutations on abundance of CFTR mRNA and rescue using PTC readthrough and NMD inhibition. Graphs show relative quantification of CFTR mRNA amplified by RT-qPCR using primers designed at 3′ and 5′ ends (dark vs. light bars, respectively). (a) Relative abundance of 5′ and 3′ fragments with three different PTC mutations (Y122X, G542X, and W1282X) compared with wt-CFTR. (b–e) Effect of PTC readthrough (G418, 250 µg/mL, 24 h), NMD inhibition (SMG1i, 0.5 µM, 24 h), or DMSO (0.5%, 24 h) on abundance of 3′ and 5′ CFTR for four different genotypes (b: wt; c: Y122X; d: G542X; e: W1282X). Ctrl = untreated cells. Values shown are means (n = 3, except for wt-Ctrl: n = 2) ±SEM, and significant differences from respective control conditions are indicated by asterisks (* p < 0.05; ** p < 0.01; *** p < 0.001).

