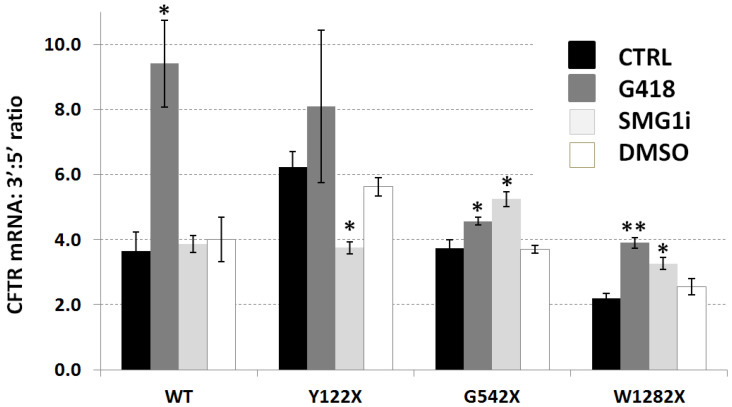
Figure 4.
Ratios of abundance of 3′ and 5′ CFTR mRNA, measured by RT-qPCR. Ratios of 3′ to 5′ transcript abundance were determined for 16HBE cells expressing wt-CFTR and three different PTC mutations (Y122X, G542X, W1282X: x-axis) under four conditions, shown in four shades (CTRL: untreated cells; G418: 500 µg/mL, 24 h; SMG1i: 1 µM, 24 h; DMSO: 0.5%, 24 h). Values shown are means (n = 3) ± SEM, and significant differences from untreated cells are indicated by asterisks (* p < 0.05; ** p < 0.01).

