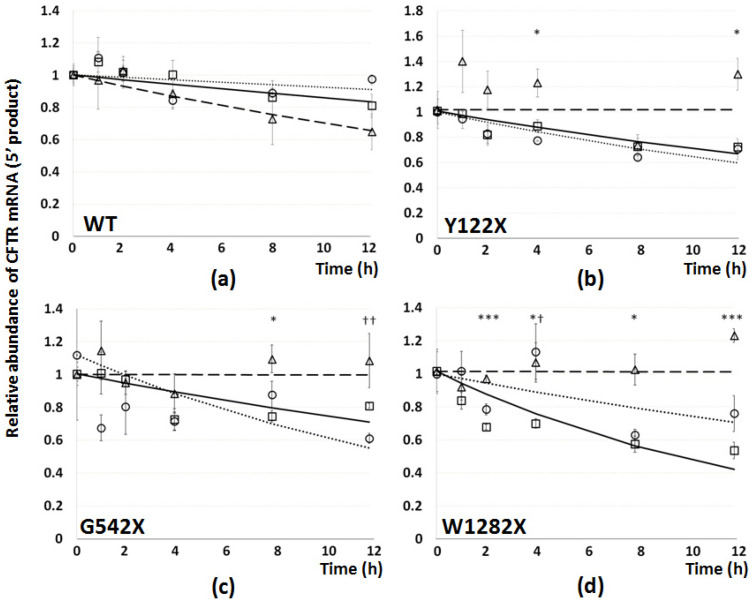
Figure 6.
Effect of PTC mutations and of treatments on CFTR mRNA stability: 5′ end. Degradation curves for CFTR mRNA were generated by RT-qPCR using the 5′ CFTR primer pair following transcriptional shutdown using Actinomycin-D, exactly as for the 3′ primer pair (Figure 5), in 16HBE cells expressing (a) wt-, (b) Y122X-, (c) G542X-, or (d) W1282X-CFTR. Relative abundance of CFTR mRNA is represented on the y-axis, and time (h) following Actinomycin-D administration on the x axis. Cells were either untreated (squares and solid regression curves) or treated with G418 (500 µg/mL for 24 h: circles and dotted line) or SMG1i (1 mM, 24 h: triangles and dashed line). Observed data values are represented by shapes (n = 3 ± SEM), and exponential degradation curves generated by best fit analysis overlaid. Significant differences between untreated cells and SMG1i (asterisks) and G418 (crosses) treatments are shown (p < 0.05, 0.01, or 0.001).

