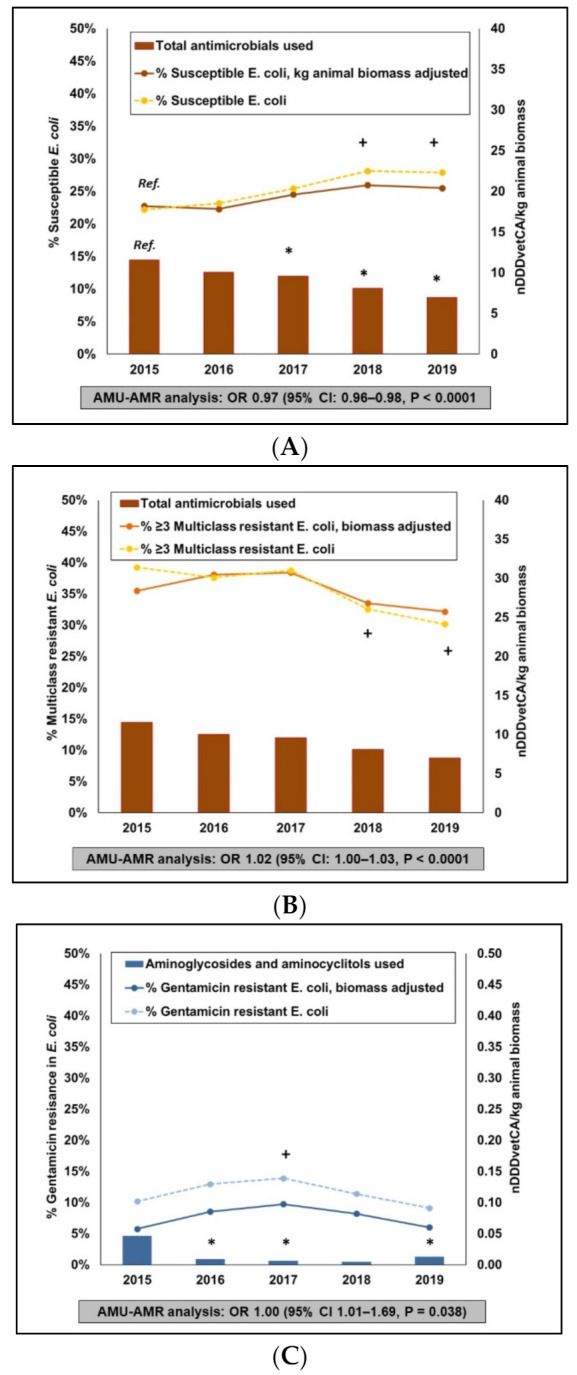
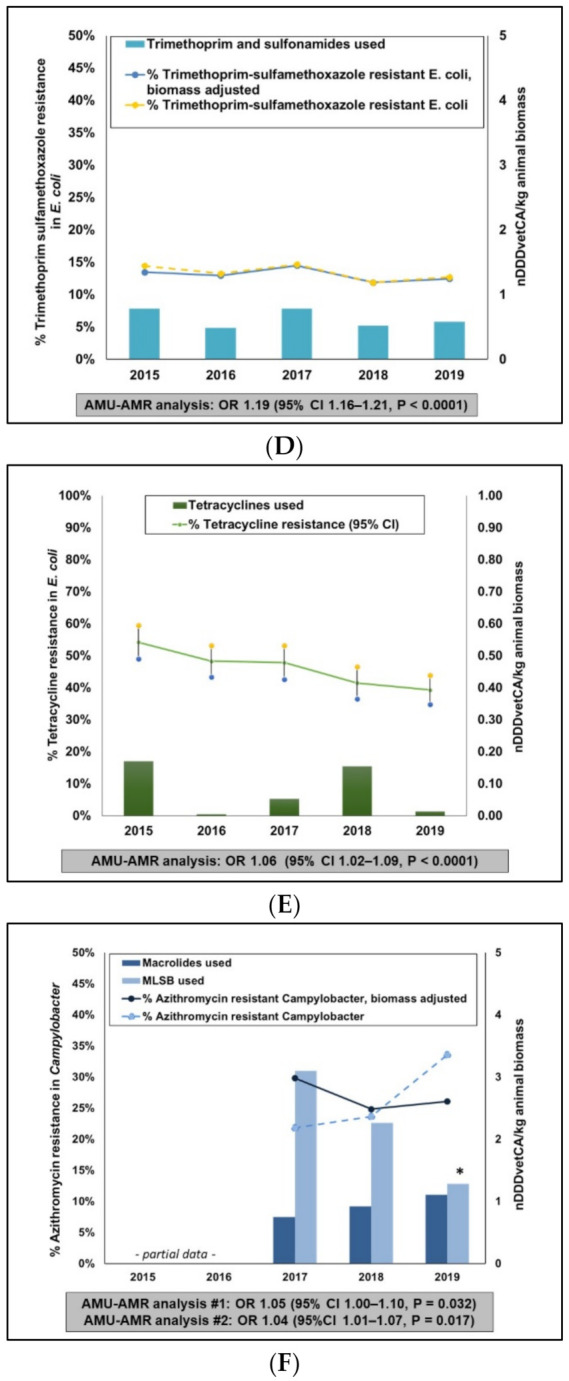
Figure 7.


Summarized, multispeciesintegration of antimicrobial use and antimicrobial resistance, between 2015 and 2019. Two AMR indicators, percentage of resistance and percentage of resistance adjusted for animal biomass are shown. Total antimicrobials used—Susceptible (i.e., isolates that exhibited reduced or intermediate susceptibility to all antimicrobials tested) (A). Total antimicrobials used—Multiclass resistance (i.e., isolates that exhibited resistance to antimicrobials from at least three different antimicrobial classes) (B). Aminoglycosides and aminocyclitols used—Gentamicin resistance (C). Trimethoprim and sulfonamides used—Trimethoprim andsulfamethoxazole resistance (D). Tetracycline used—Tetracycline resistance (E). Analysis #1: Macrolides used—Azithromycin resistance and Analysis #2: Macrolides, lincosamides and streptogramin B use (MLSB)—Azithromycin resistance (F).* Significant (p ≤ 0.05) difference in AMU compared to the referent year (2015, labelled as Ref. in (A)). + Significant (p ≤ 0.05) difference in AMR compared to the referent year (2015). OR—Odds Ratio, 95%CI—95% confidence intervals. Data points for AMU are overall mean nDDDvetCA/kg animal biomass. Figure 7F contained partial data for 2015 (broiler chickens only) and 2016 (broiler chickens and turkeys). AMU-AMR associations were evaluated using two-level mixed effects logistic regression models.
