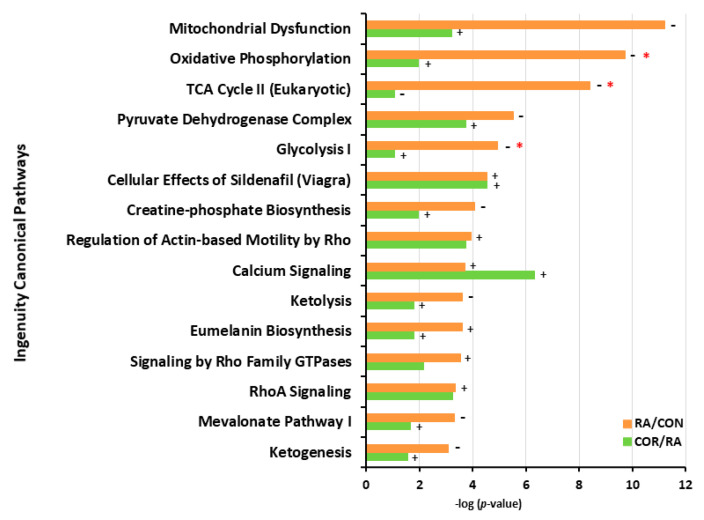
Figure 5.
The most significantly altered pathways induced by RA and the effects of coriander treatment. The top 15 canonical pathways in the RA/CON comparison are presented in orange color, whereas the same pathways involved in the COR/RA comparison are presented in green color. “+” indicates that the pathway was predicted to be activated, whereas “–” indicates that the pathway was predicted to be inhibited. “*” in red color represents credible (absolute z-score > 2). −log (p-value) > 1.3 represents p-value < 0.05.

