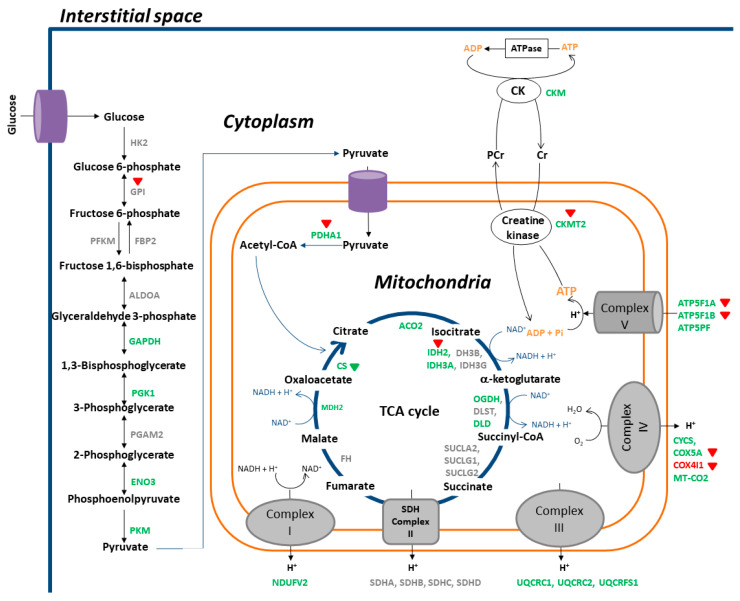
Figure 6.
A schematic representation of molecular alterations involved in energy metabolism occurring in gastrocnemius muscles affected by RA and the effects of coriander treatment. Proteins with no significant change or no detection are in gray color. Proteins that were downregulated by RA are in green color, whereas these were upregulated are in red color. Triangles in red color indicate the upregulating effects of coriander, whereas triangles in green color indicate the downregulating effects of coriander.

