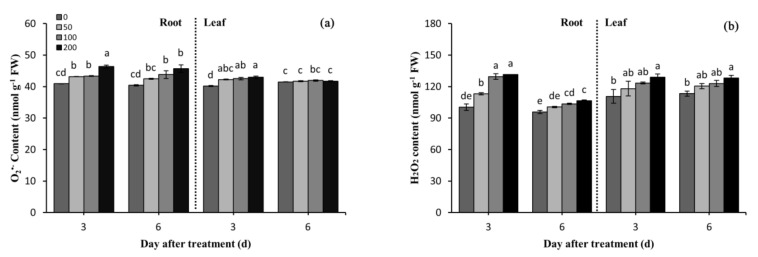
Figure 2.
Effects of difenoconazole on O2•− (a) and H2O2 (b) contents in leaves and roots of wheat seedlings. Different lowercase letters indicate significant difference (p < 0.05). Error bars indicate standard errors calculated for three replications. The 0, 50, 100, and 200 represent the different treatment concentrations.

