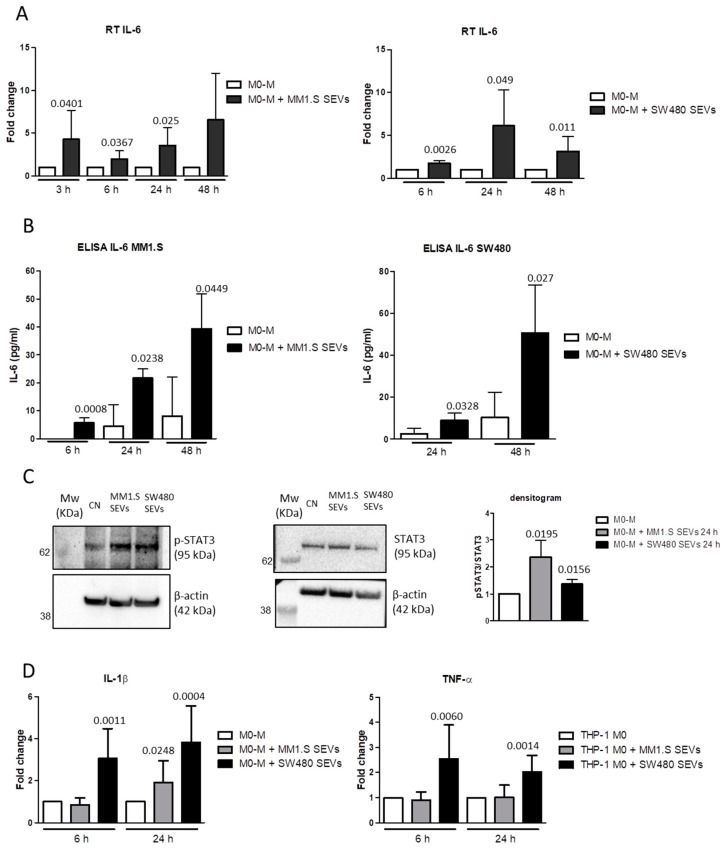
Figure 3.
(A, left panel) RT PCR of IL-6 mRNA levels in M0-M treated with MM1.S-SEVs for 3, 6, 24, and 48 h. The reported values are the mean ± standard deviation of three replicates at least. (A, right panel) RT PCR of IL-6 mRNA levels in M0-M treated with SW480-SEVs for 6, 24, and 48 h. The reported values are the mean ± standard deviation of four replicates at least. (B, left panel) ELISA assay of IL-6 released in the conditioned media of M0-M treated with MM1.S-SEVs for 6, 24, and 48 h. The reported values are the mean ± standard deviation of three replicates. (B, right panel) ELISA assay of IL-6 released in the conditioned media of M0-M treated with SW480-SEVs for 24 and 48 h. The reported values are the mean ± standard deviation of four replicates. (C, left panel) Western Blot analysis of P-STAT3, STAT3, and β-actin proteins in M0-M treated with MM1.S- and SW480-SEVs for 24 h. (C, right panel) Densitometric analysis of the Western Blot. The reported values are the mean ± standard deviation of three replicates. (D) RT PCR of IL-1β and TNFα mRNA levels in M0-M treated with MM1.S- and SW480-SEVs for 6 and 24 h. The reported values are the mean ± standard deviation of six replicates at least. The statistical significance of the differences between the SEV-treated and untreated M0-M cells for each time point was analyzed using a two-tailed Student’s t-test.

