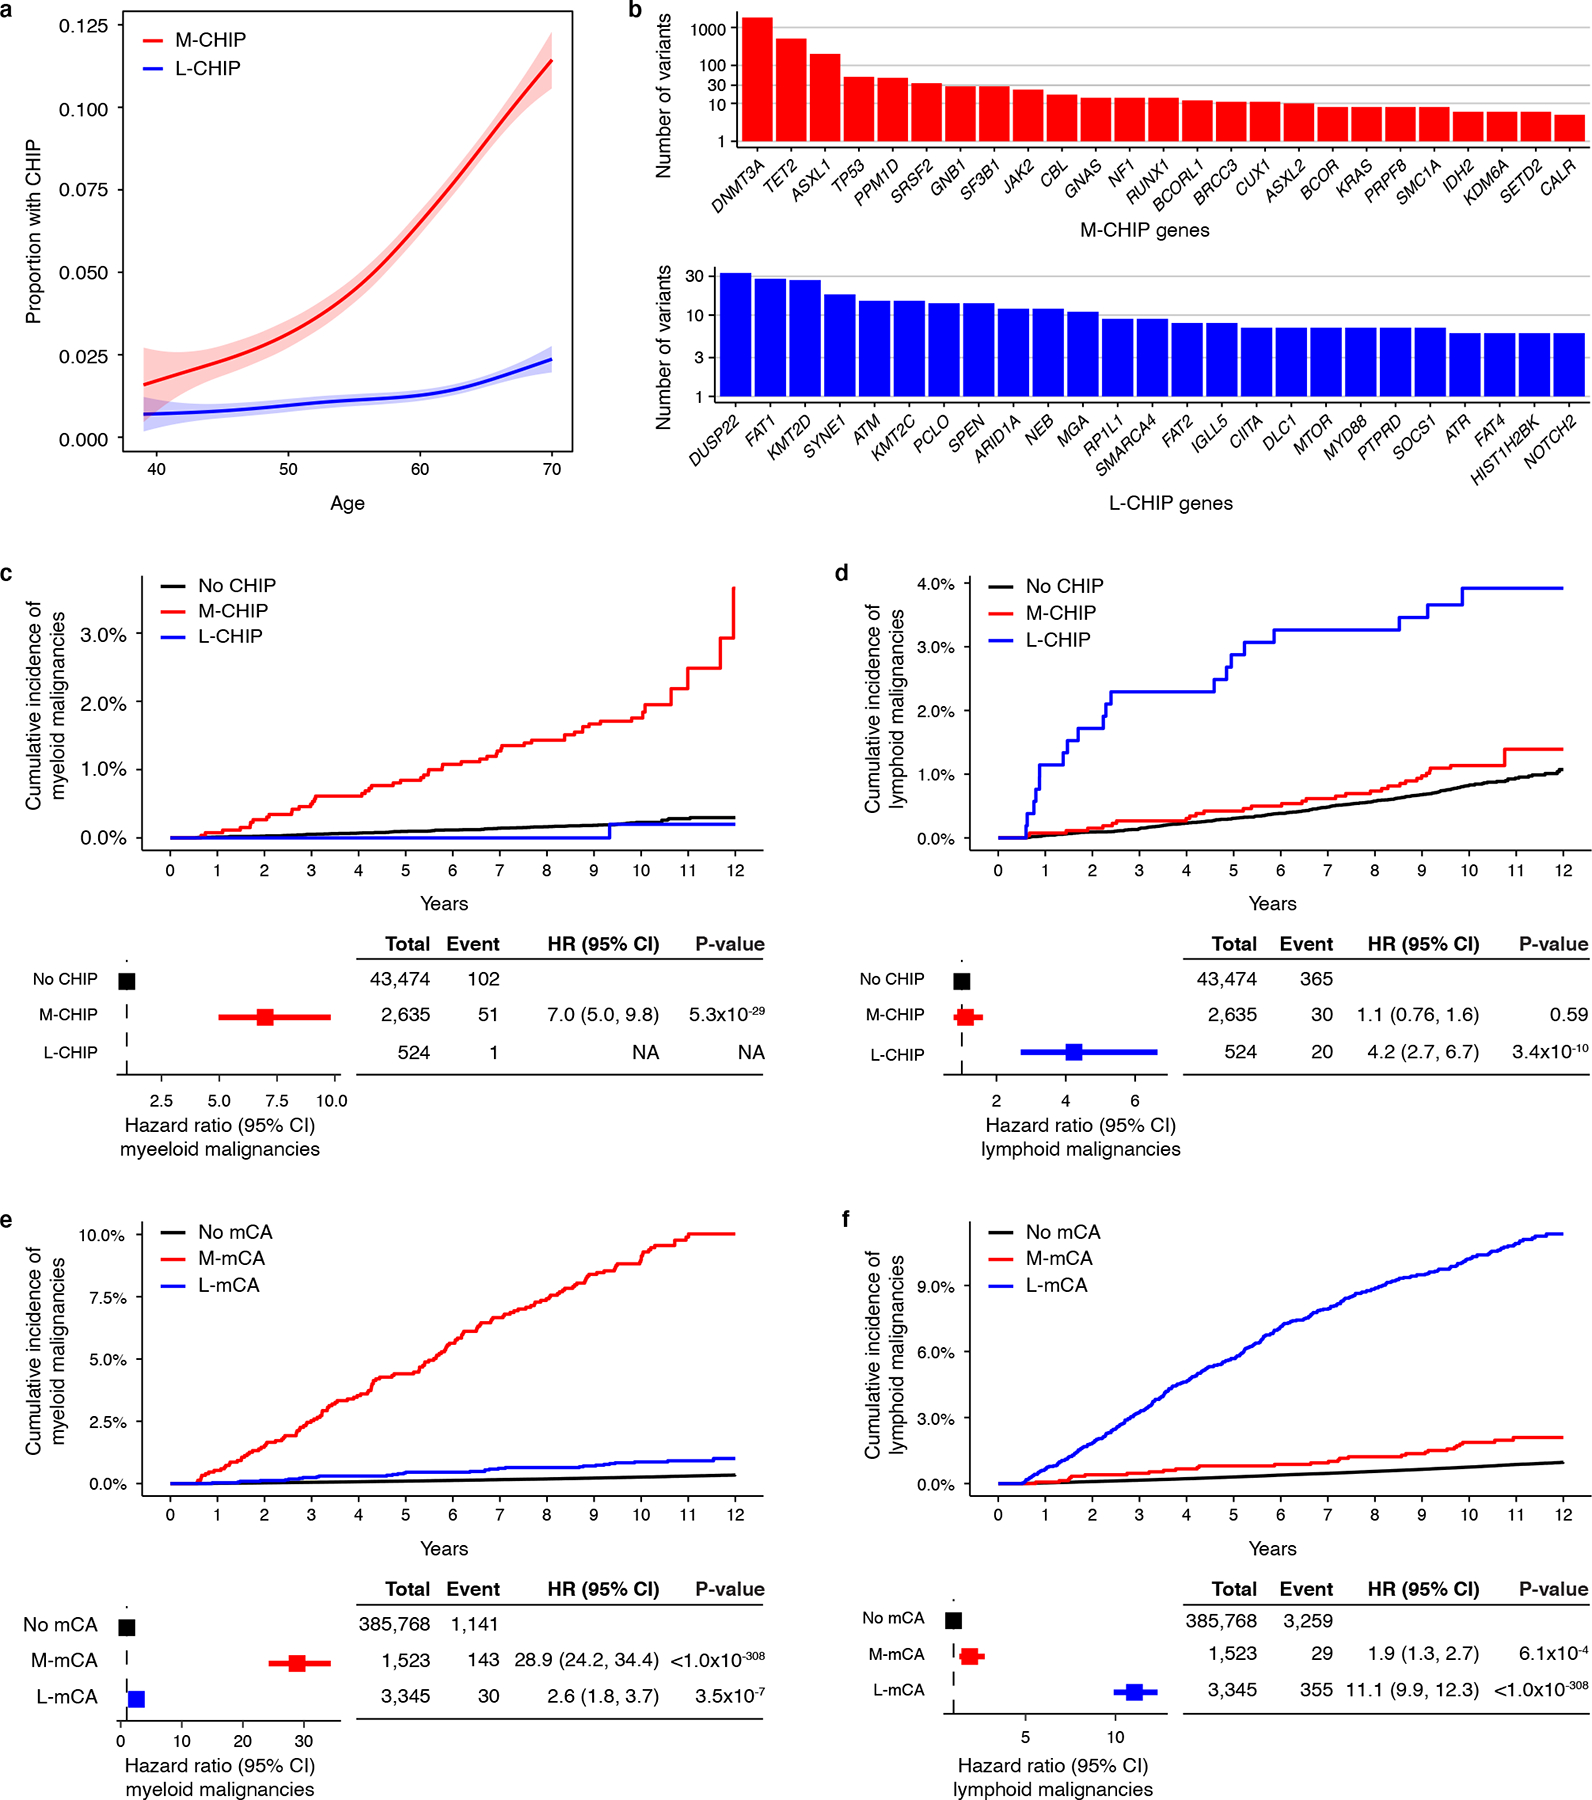
Figure 1: CH with myeloid and lymphoid drivers stratify risk of lineage-specific malignancies.

a) Prevalence of M-CHIP and L-CHIP increase with age. Data is fit with the general additive model using cubic regression splines and the shaded bands indicate the estimated 95% confidence interval. b) Frequencies of somatic variants detected in top 25 myeloid and lymphoid driver genes. c-d) M-CHIP and L-CHIP increase risk of myeloid and lymphoid malignancies, respectively. Individuals carrying both M-CHIP and L-CHIP (n=73) were excluded of whom five developed a myeloid malignancy and one developed a lymphoid malignancy. Hazard associated with L-CHIP for developing myeloid malignancies could not be computed due to small number of events. e-f) M-mCA and L-mCA increase risk of myeloid and lymphoid malignancies, respectively. Individuals carrying A-mCA and unclassified mCAs were excluded. The incidence curves are un-adjusted for covariates. (c-f) Data are presented as hazard ratio and 95% confidence intervals, computed by Cox proportional hazards model adjusting for age, sex, smoking, genetic ethnic ancestry, and genetic principal components 1–5. M-CHIP, CHIP with myeloid driver, L-CHIP, CHIP with lymphoid driver; M-mCA, mCA with myeloid driver; L-mCA, mCA with lymphoid driver; A-mCA, mCA with ambiguous driver; HR, hazard ratio; CI, confidence interval.
