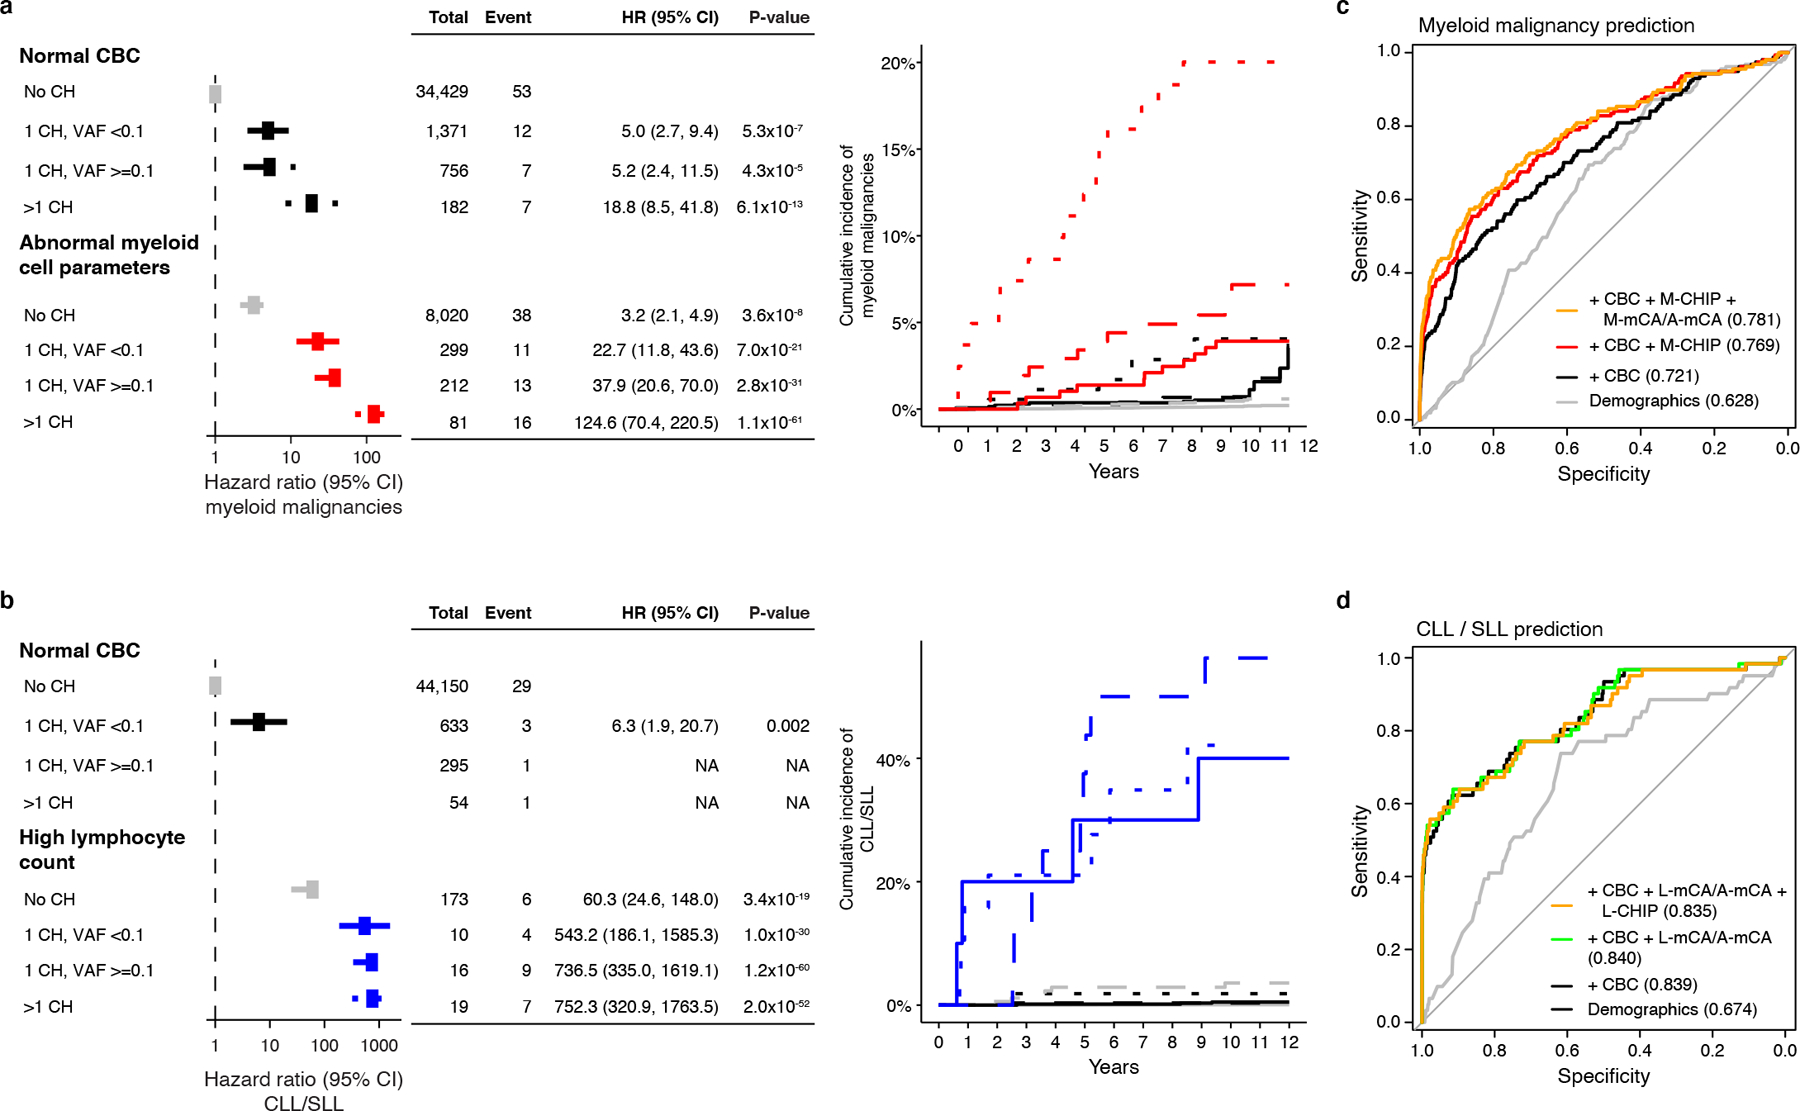
Figure 3: CH and CBC parameters predict the risk of developing myeloid malignancies and CLL/SLL.

a) CH with myeloid drivers (M-CHIP, M-mCA, or A-mCA) and abnormal myeloid cell parameters increase risk of myeloid malignancies. b) CH with lymphoid drivers (L-CHIP, L-mCA, or A-mCA) and high lymphocyte count increase risk of CLL/SLL. Hazards associated with groups with <3 events were not computed. (a-b) Data are presented as hazard ratio and 95% confidence intervals, computed by Cox proportional hazards model adjusting for age, sex, smoking, genetic ethnic ancestry, and genetic principal components 1–5. c) Sensitivity and specificity curves for predicting the incidence of myeloid malignancies computed by 10-fold cross-validation. Individuals with a diagnosis of myeloid malignancy (n=157) and those that did not have a diagnosis of myeloid or lymphoid malignancies (n=44781) were used for training and testing. d) Sensitivity and specificity curves for predicting the incidence of CLL/SLL computed by 10-fold cross-validation. Individuals with a diagnosis of CLL or SLL (n=61) and those that did not have a diagnosis of myeloid or lymphoid malignancies (n=44781) were used for training and testing. (c-d) Baseline predictor included demographic characteristics (age, sex, smoking status, and genetic ethnic ancestry). CHIP (number of CHIP variants and maximum VAF), mCA (number of alterations and maximum cell fraction), and CBC were added as predictors together with demographic characteristics. The values inside the parentheses indicate the AUC. Since A-mCA were associated with risk of both myeloid and lymphoid malignancies, these are combined with M-mCA in the analysis of myeloid malignancies and with L-mCA in the analysis of lymphoid malignancies. HR, hazard ratio; CI, confidence interval; CLL, chronic lymphocytic leukemia; SLL, small lymphocytic lymphoma; CBC, complete blood count; VAF, variant allele fraction; AUC, area under the curve.
