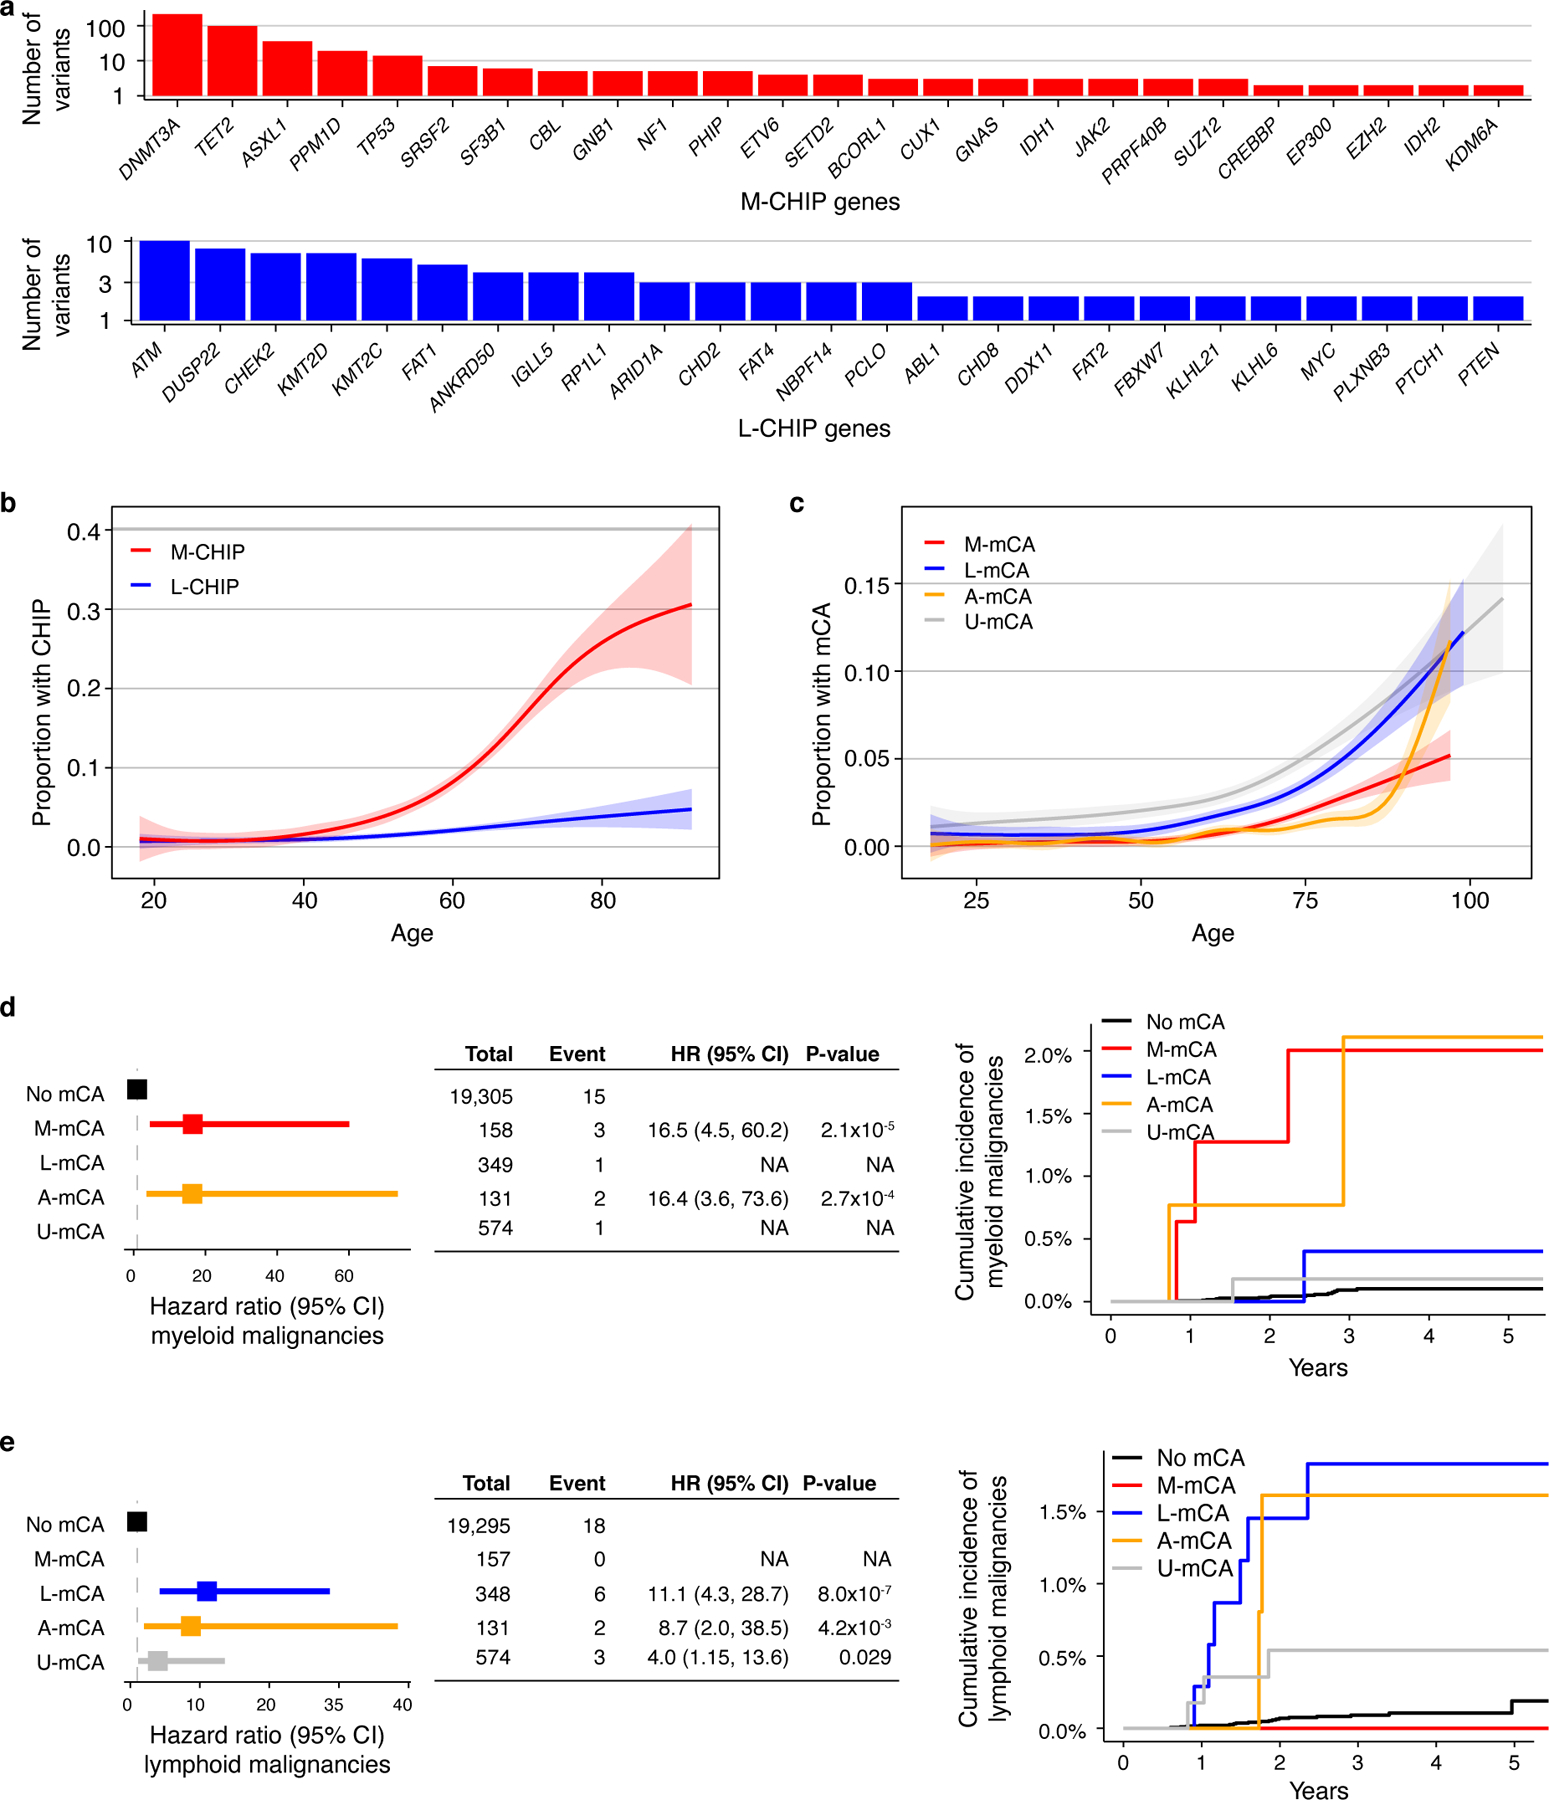
Extended Data Fig. 4. Myeloid and lymphoid CHIP and mCAs identified in the MGBB cohort.

a) Top 25 myeloid and lymphoid driver genes mutated in MGBB cohort. b) Prevalence of M-CHIP and L-CHIP increase with age. c) Prevalence of M-mCA, L-mCA, and U-mCA increase with age. A-mCA were excluded because of small sample size. (b-c) Data is fit with the general additive model using cubic regression splines and the shaded bands indicate the estimated 95% confidence interval. d-e) M-mCA and L-mCA increase risk of myeloid and lymphoid malignancies, respectively. The incidence curves are un-adjusted for covariates. Data are presented as hazard ratio and 95% confidence intervals, computed by Cox proportional hazards model adjusting for age, sex, and genetic principal components 1–5. Incident multiple myeloma (MM) and monoclonal gammopathy of undetermined significance (MGUS) cases were excluded since those were only weakly associated with L-mCA in the UKB cohort. Groups with <2 events were excluded in the Cox model. M-CHIP, CHIP with myeloid driver, L-CHIP, CHIP with lymphoid driver; M-mCA, mCA with myeloid driver; L-mCA, mCA with lymphoid driver; A-mCA, mCA with ambiguous driver; U-mCA, unclassified mCAs; HR, hazard ratio; CI, confidence interval.
