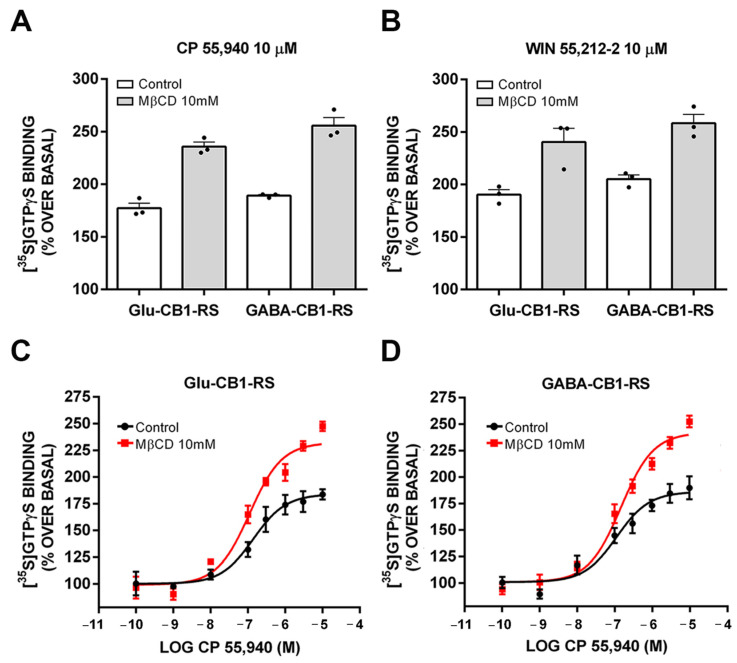
Figure 6.
CB1 receptor coupling to Gαi/o proteins in control and 10 mM MβCD pretreated synaptosomes from frontal cortical tissue of Glu-CB1-RS and GABA-CB1-RS mice. (A,B) Bar graph of 10 µM CP 55,940 and 10 µM WIN 55,212-2-stimulated maximal [35S]GTPγS binding. (C,D) Concentration–response curves for the CP 55,940-stimulated [35S]GTPγS binding. Concentration–response curves were constructed using mean values ± SEM from triplicate data points of three independent experiments. Emax values are expressed as % specific [35S]GTPγS bound of basal.

