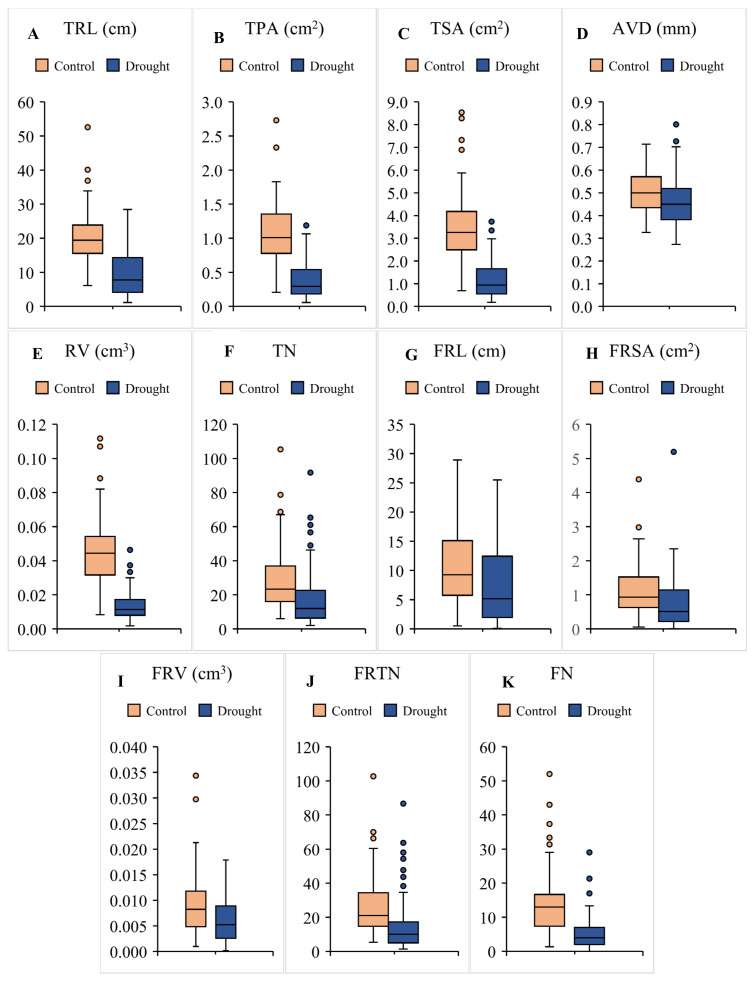
Figure 1.
Genotypic variation in (A) total root length (TRL), (B) total projected area (TPA), (C) total surface area (TSA), (D) average diameter (AVD), (E) root volume (RV), (F) tips number (TN), (G) fragile root length (FRL), (H) fragile root surface area (FRSA), (I) fragile root volume (FRV), (J) fragile roots tips number (FRTN) and (K) fork number (FN) among lentil genotypes. Each box represents interquartile range. Horizontal bar in each box shows median. Whiskers show the range and dots represent outliners.

