Figure 1.
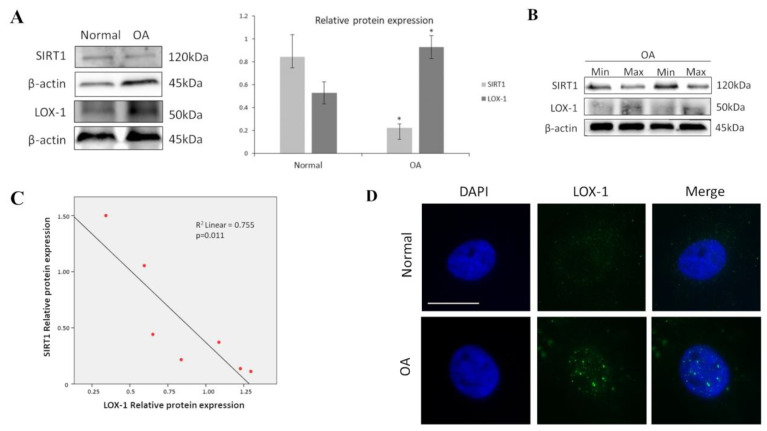
SIRT1 and LOX-1 protein expression are inversely correlated in OA chondrocytes. (A) Representative immunoblot showing differential protein expression of SIRT1 and LOX-1 in OA chondrocytes. Antibody against β-actin was used as loading control. p-values less than 0.05 were considered statistically significant, as indicated by the asterisk symbols in the graphs: * = p < 0.05. (B) Differential protein expression of SIRT1 and LOX-1 in OA chondrocytes isolated from joints with maximal damage (max) compared to the same joints with minimum degradation (min). (C) Pearson’s rank correlation analysis was used to determine the association between expression levels of SIRT1 and LOX-1 in OA chondrocytes. R2 Linear: coefficient of determination (goodness-of-fit measure of the model). (D) Immunofluorescence analysis of LOX-1 in OA chondrocytes. Representative images of normal and OA chondrocytes stained with anti-LOX-1 antibody and the appropriate secondary antibody. Nuclei were stained with DAPI (blue). Images were captured with 100× objective lens of the fluorescent microscope used. Scale bar 25 μm.

