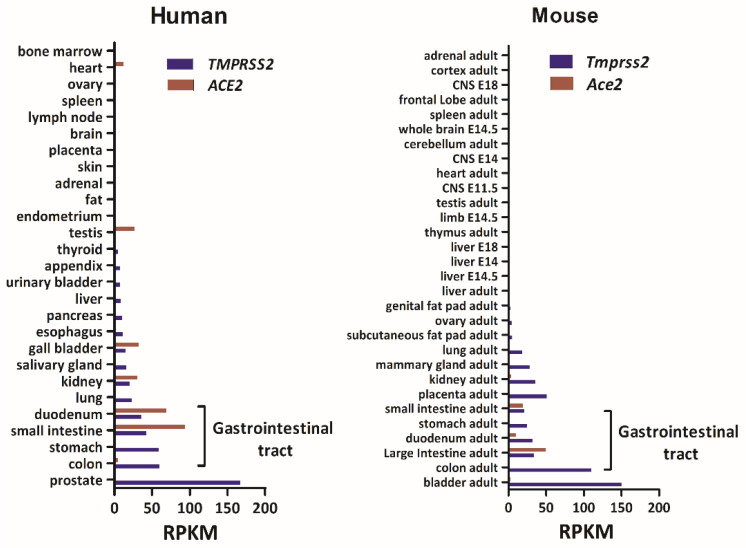
Figure 1.
Bar charts of the mRNA levels of TMPRSS2 and ACE2 in human and mouse tissues. Data on mRNA levels of these two genes across the tissues were obtained from the National Center for Biotechnology Information website (https://www.ncbi.nlm.nih.gov/, accessed on 15 December 2020). The x-axis indicates the gene expression level in reads per kilobase per million mapped reads (RPKM) units. The y-axis indicates the tissues.

