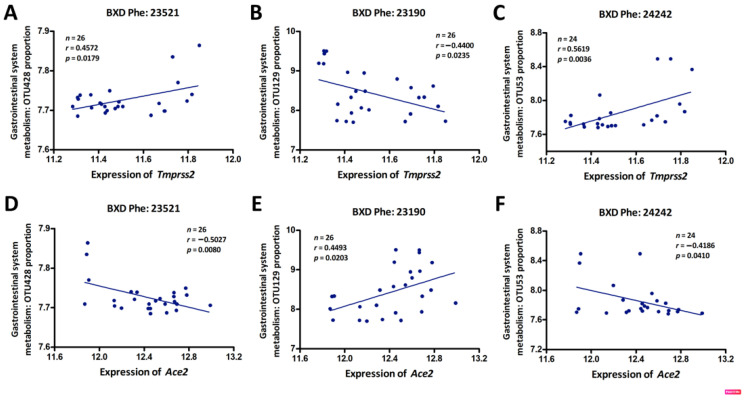
Figure 4.
Scatter plots of the correlations between Tmprss2 or Ace2 expression and GI system microbiota phenotypes: OTU428 (A,D), OTU129 (B,E), and OTU53 (C,F). The Pearson correlation coefficient was used to determine the relationship. The Pearson correlation r and p-values are indicated in the figure. The gene expression levels were log2-transformed.

