Figure 5.
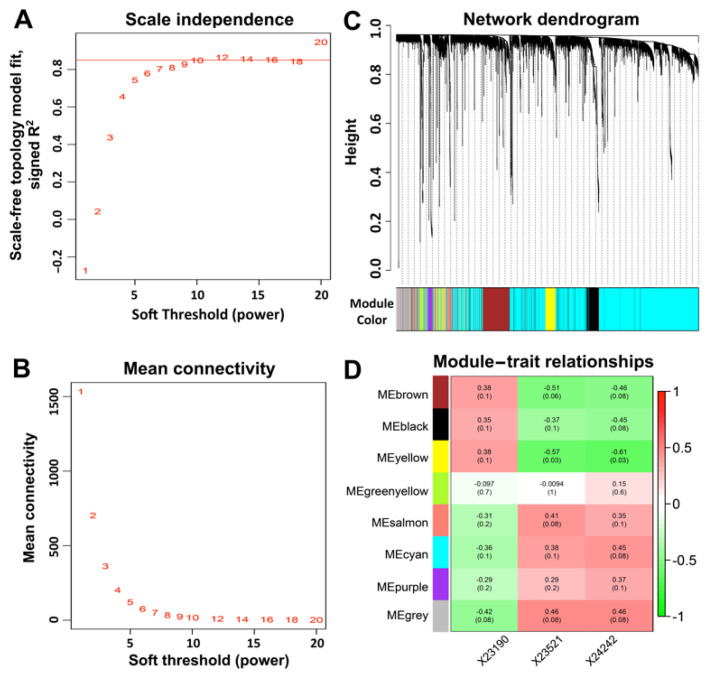
WGCNA modules that were associated with Tmprss2 and Ace2 expression. (A) Soft thresholding index R2 as a function of the soft-thresholding power β. A β = 12 indicated a scale-free topology. (B) Mean connectivity (degree) as a function of β. (C) Eight co-expression modules were identified from the ~4100 transcripts that co-varied with both Tmprss2 and Ace2 in the GI transcriptome data using dendrogram branch cutting. (D) Associations (Pearson correlation r with FDR in parentheses) between module eigengenes and GI microbiota phenotypes.

