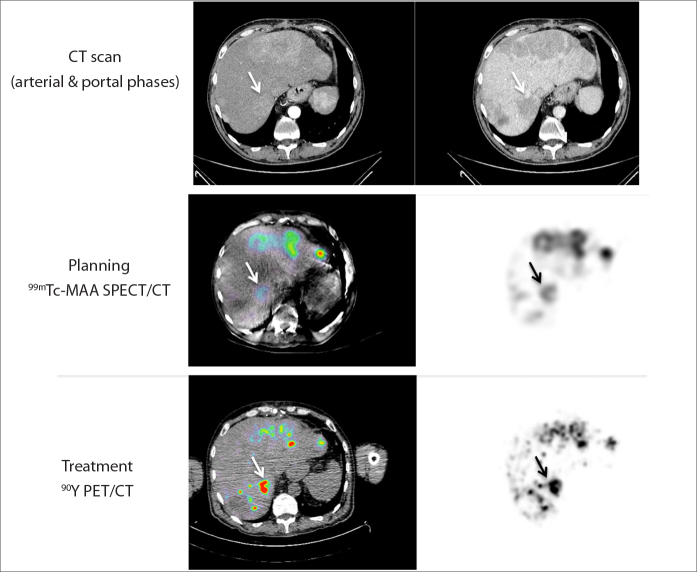
Figure 2.
Example of a patient treated by liver radioembolization for high hypervascular neuroendocrine metastases demonstrated on CT scan (upper panel). The planning (middle panel) was performed with a classic end-hole catheter; T/NL and tumor dose were respectively 2.9 and 69 Gy in the tumor located in segment 7 (arrow). The treatment (lower panel) was performed with an antireflux catheter; T/NL and tumor dose were respectively 8.4 and 172 Gy in this same tumor (arrow).

