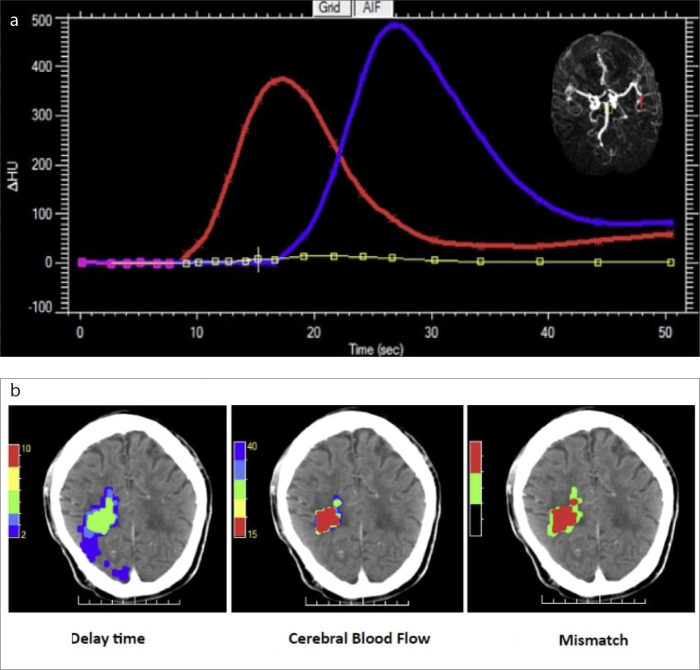
Figure 3. a, b.
CTP perfusion maps in delineating the infarcted core and penumbra. The arterial (red) and venous (blue) input curves (a), measured from the right MCA and the venous sinus, are shown. A MIP is shown in the top right (a), showing an occlusion of the MCA. These maps were processed by MiStar™ to create perfusion maps (b), namely the delay time (DT) map, cerebral blood flow (CBF) map, and mismatch map (left to right). The axial DT map shows volumes of critically hypoperfused tissue, including both the infarcted core and the penumbral tissue at risk of infarction, based on various thresholds: DT >6.0 s, 0 mL; DT >4.0 s, 4 mL; DT >3.0 s, 12 mL; DT >2.0 s, 95 mL. A threshold DT >3.0 s indicated a volume of 12 mL. The axial CBF map shows the infarcted core volumes, based on various thresholds: CBF <40%, 7 mL; CBF <35%, 6 mL; CBF <30%, 5 mL; CBF <20%, 3 mL; CBF <15%, 1 mL. A threshold of CBF <30% indicated a volume of 5 mL (42% of the total lesion). The axial mismatch map shows the infarcted core and penumbra superimposed on the NCCT image to better identify the mismatch volume (7 mL, equivalent to 58% of the total lesion). The penumbral to the core volume ratio of 2.4. Hence, there is a benefit associated with endovascular thrombectomy within 24 hours of stroke symptom onset and in the absence of other clinical contraindications.

