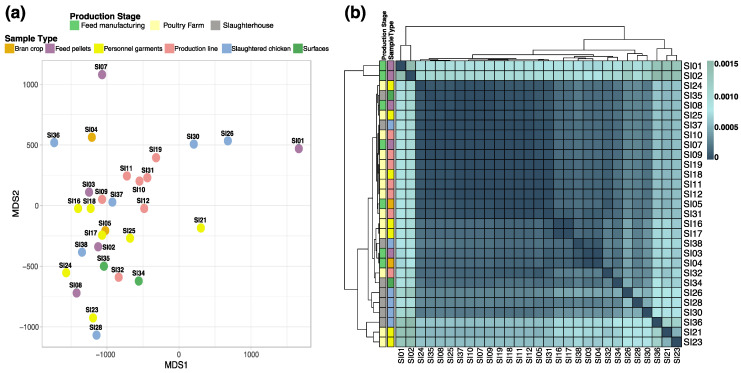
Figure 3.
Genomic similarities among the S. Infantis strains. (a) Multidimensional scaling (MDS) plot based on average nucleotide identity (ANI) similarity index among the 29 S. Infantis genomes. (b) Heatmap representation of 29 genomes using Mash, heat scale is based on the pairwise Mash distances (identical genomes report a Mash distance of 0), the left and top dendrograms corresponds to complete-linkage hierarchical clustering. Colors of the dots and heatmap left columns represents the production stage and sample type.

