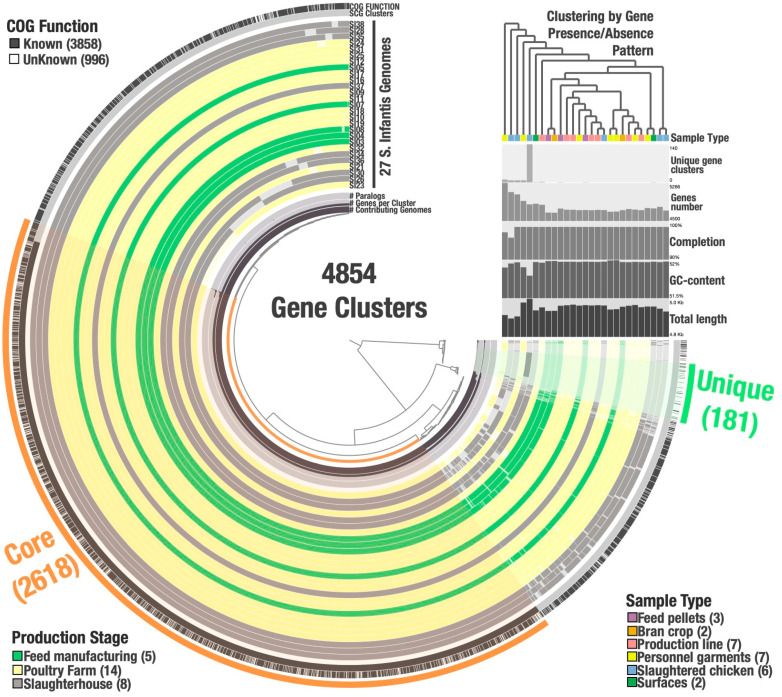
Figure 5.
The pangenome of S. Infantis. Each of the 4854 gene clusters contains genes contributed by one or more isolate genomes. Gene clusters are organized based on their distribution across genomes (defined by the tree in the center), and genomes are organized in radial layers based on Euclidian distance and Ward ordination of the gene clusters they share. Visualization described from the inside out: the first three layers show (1) the number of genomes in which the corresponding cluster is present; (2) the number of genes in the corresponding cluster, and (3) the number of paralogs in the corresponding cluster. The middle 27 layers are the genomes, and the bars indicate the occurrence of a given gene cluster in that strain, colored by their origin on the production stage. The top two outside layers describe (1) the single copy core-gene clusters for the 27 genomes and (2) the gene clusters in which at least one gene was functionally annotated using COGs. Finally, the outside selections correspond to the Core gene clusters (2618), and those present exclusively in one strain (Unique: 181). The upper-right section provides additional data for each genome (from bottom to top): genome total length, GC-content (%), completion (%), number of genes, number of unique genes, the genome classification based on sample type origin and the dendrogram at the top depicts the hierarchical clustering of genomes based on the occurrence of gene clusters.

