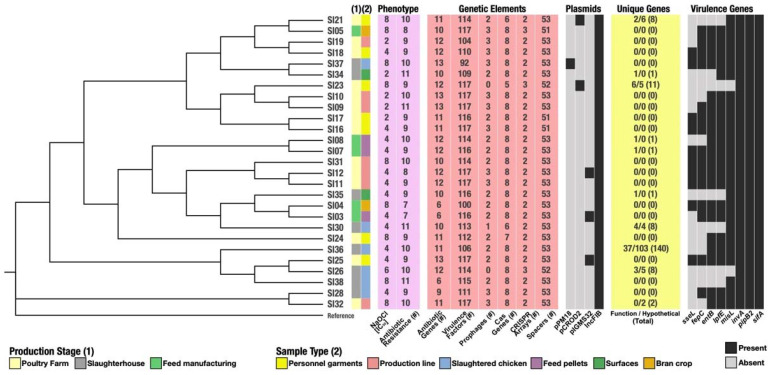
Figure 6.
Schematic representation of the characteristics of the 27 S. Infantis strains. The organization is according to the SNP-based phylogeny and categorized by their production stage and sample type origins. The purple panel shows the number of antibiotics to which the corresponding strain is resistant and their IC50 value against NaOCl. The pink panel shows the number of different genetic elements detected in the corresponding strain. The gray heatmaps represent the presence/absence pattern for known plasmids and genes of interest (virulence). Finally, the yellow panel shows the number of unique genes: those with functional annotation, those translating to hypothetical proteins and the total of unique genes, for the corresponding strain.

