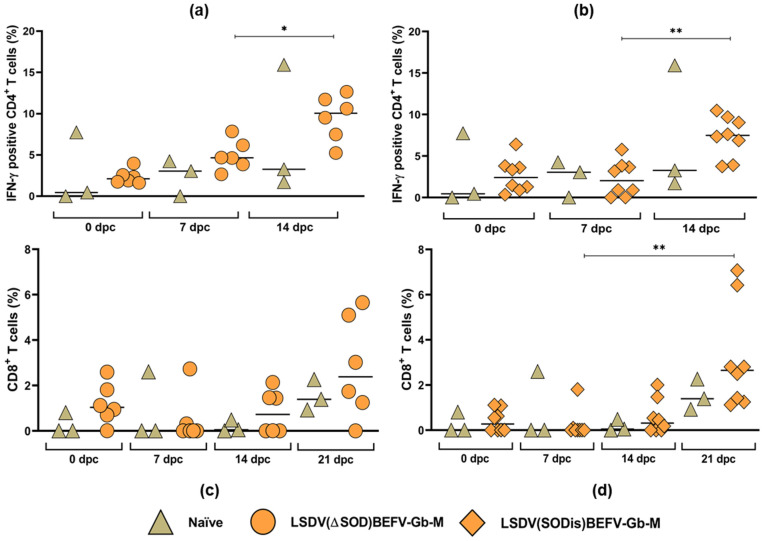
Figure 12.
T cell responses to LSDV following virulent LSDV challenge. Whole blood was stimulated with LSDV for 24 h and IFNγ-secreting CD4+ and CD8+ T cells were measured. (a,b) the average % IFNγ- secreting CD4+ T cells from 0–14 dpc from cattle vaccinated with LSDV(∆SOD)BEFV-Gb-M (circles) and LSDV(SODis)BEFV-Gb-M (diamonds), respectively; (c,d) the average % CD8+ T cells from 0–21 dpc from cattle vaccinated with LSDV(∆SOD)BEFV-Gb-M (circles) and LSDV(SODis)BEFV-Gb-M (diamonds), respectively; the green diamonds represent unvaccinated naïve cattle. Statistical analyses were conducted using Welch one-way ANOVA with Dunnett’s T3 multiple comparison test (a,b) and Kruskal–Wallis test with Dunn’s multiple comparison test (c,d). Horizonal lines indicate median values. * p < 0.05, ** p < 0.01.

