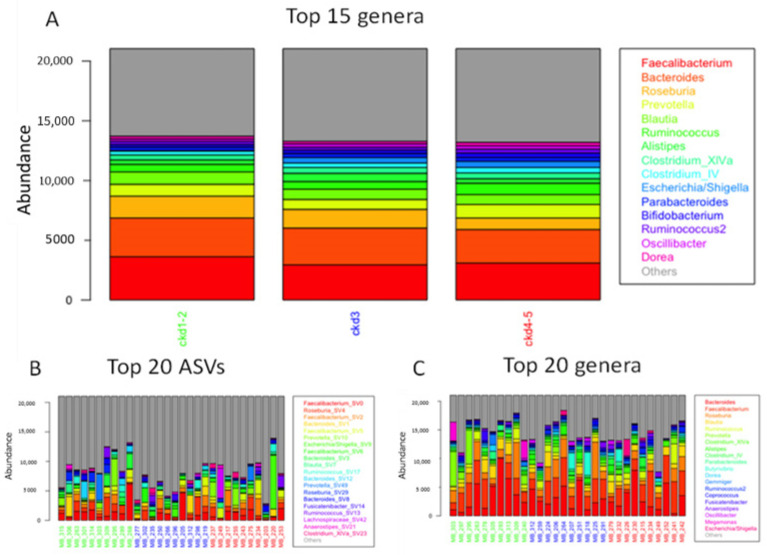
Figure 1.
Mean abundance of the top genera or ASVs computed across all CKD stage-specific samples. (A) mean abundance of the top 15 genera in the different CKD stage groups; (B) mean abundance of the top 20 ASVs in 10 randomly selected samples per CKD stage group; (C) mean abundance of the top 20 genera in 10 randomly selected samples per CKD stage group. CKD: chronic kidney disease; ASV: 16S rRNA amplicon sequence variant.

