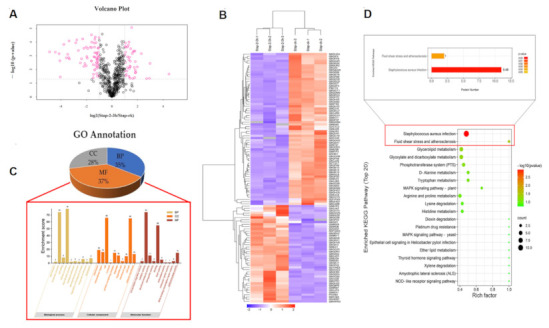
Figure 3.

Proteomics results of S.aureus treated with actinomycin D. (A) Volcano plot of DEPs, Stap-2–3 h represents the treatment group, Stap-ck represents the control group, and DEPs (Regulated > 2.0-fold; p < 0.05) are represented by the pink color. (B) Hierarchical cluster analysis of all the DEPs. (C) Gene ontology annotation of differentially expressed proteins. BP represents the biological processes, MF represents molecular function and CC represents the cellular components of proteins; the top 10 enrichments of BP, CC, and MF are shown. (D) Top 20 KEGG pathways of the identified DEPs. Color represents p-value; the red color represents low p-value, the green color represents high p-value; the pathways with a red color represent those that are altered and the circle size represents gene number.
