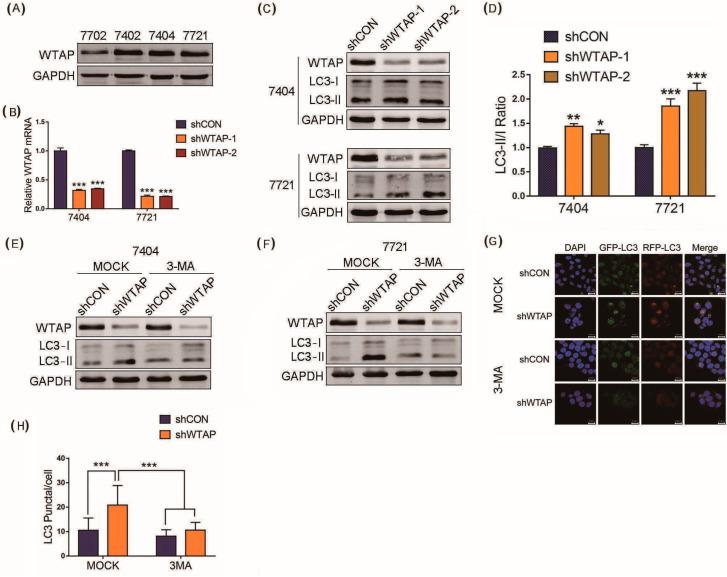
Figure 1.
Knockdown of WTAP facilitating autophagy of HCC. (A) Western blot analysis of basal expression of WTAP in different HCC cell lines. (B) RT-qPCR analysis of WTAP transcripts from shWTAP cells and shCON cells. (C) Western blot analysis of LC3-I and LC3-II in shWTAP SMMC-7721 cells and shWTAP BEL-7404 cells. (D) Statistical analysis of LC3 II/LC3 I ratio between shCON and shWTAP group. (E) Western blot analysis of LC3-I and LC3-II in WTAP-knockdown BEL-7404 cells treated with or without 3-MA. (F) Western blot analysis of LC3-I and LC3-II in WTAP-knockdown SMMC-7721 cells treated with or without 3-MA. (G) Cofocal microscopy analysis of LC3 in shWTAP cells treated with or without 3-MA. (H) Statistical analysis of LC3 puncta in shWTAP cells and shCON cells, as well as 3-MA-treated cells. Error bars indicate the mean ± SD from three independent experiments (n = 3). p values was used to indicate statistica difference. * p < 0.05, ** p < 0.01 and *** p < 0.001.

