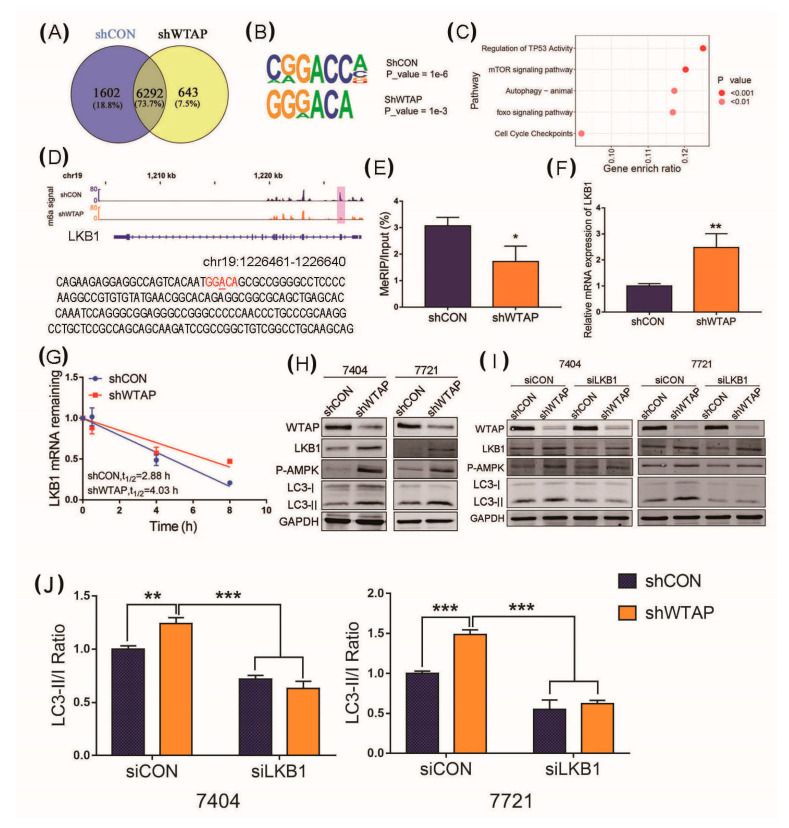
Figure 4.
Knockdown of WTAP facilitating autophagy through upregulation of LKB1. (A) Venn diagram showing the difference in m6A peaks between shCON and shWTAP cell lines. (B) Conserved m6A motif found in schON and shWTAP HCC cell lines. (C) Signal pathway analysis of the different m6A modified genes between shCON and shWTAP HCC cell lines. (D) The m6A motif found in LKB1 transcript through sequencing. (E) MeRIP-qPCR analysis of cellular m6A levels in shCON and shWTAP HCC cell lines. (F) RT-qPCR used for the abundance analysis of LKB1 transcript in shCON and shWTAP HCC cell lines. (G) Half-life analysis of RNA stability of LKB1 transcript in shCON and shWTAP HCC cell lines. (H) Western blot analysis of LKB1, p-AMPK, LC3-I and LC3-II in shCON and shWTAP cells. (I) Western blot analysis of LKB1, p-AMPK, LC3-I and LC3-II in shCON and shWTAP cells, as well as in siLKB1 cells. (J) Statistical analysis of LC3 -II/LC3-I ratio between shCON and shWTAP-treated 7404 and 7721 cell lines. Error bars indicate the mean ± SD from three independent experiments (n = 3). * indicate a statistically significant difference (p < 0.05) and ** indicate a statistically significant difference (p < 0.01), *** indicate a statistically significant difference (p < 0.001).

