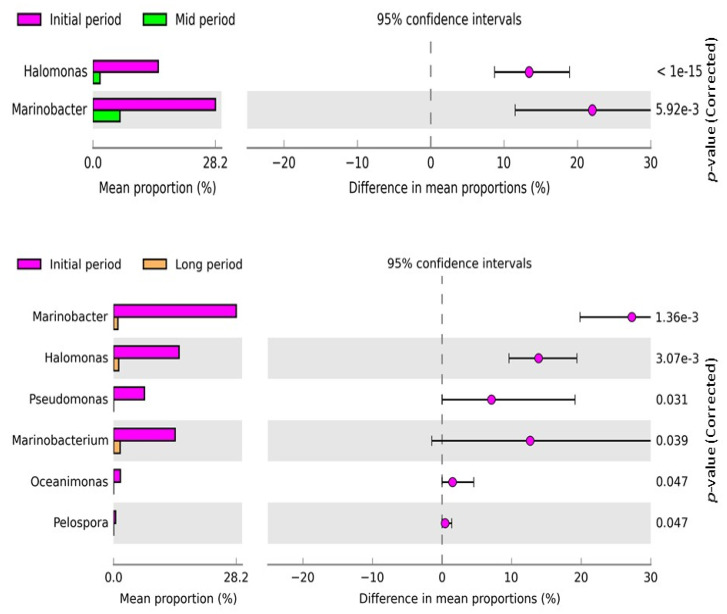
Figure 5.
Post hoc plot of the significantly enriched bacterial genera of the samples collected at various time intervals. The figures show the abundance of the enriched bacterial genus in the left-side panel, the mean proportion (%) of the enriched bacterial genus in the middle, and the significant difference (p < 0.05) in the right-side panel. Two and six bacterial genera were significantly different between the initial- and mid-period samples and initial- and long-period samples, respectively.

