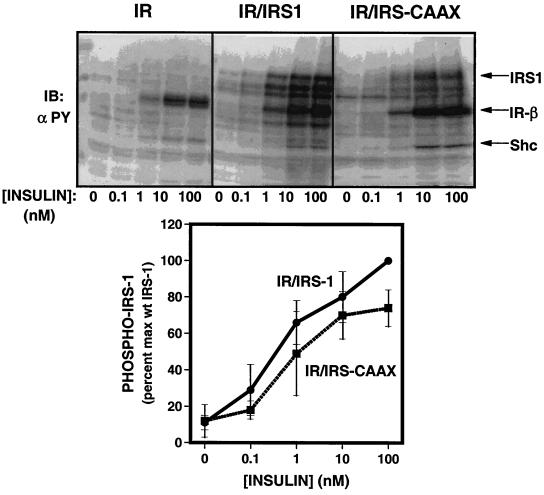
FIG. 4.
Tyrosine phosphorylation of IRS-1 and IRS-CAAX. (Top) 32DIR cell lines matched for IR and IRS isoform expression were starved for 4 h and then incubated for 5 min in the presence of 0 to 100 nM insulin. Lysates were resolved by SDS-PAGE, transferred to nitrocellulose, and analyzed for tyrosine phosphorylation by immunoblotting with antiphosphotyrosine antibody (αPY). (Bottom) Quantitation of the tyrosine phosphorylation dose-response experiment. Data have been normalized for amount of IRS-1 expressed in each cell line. Data are expressed as means ± standard errors of the mean from four experiments.

