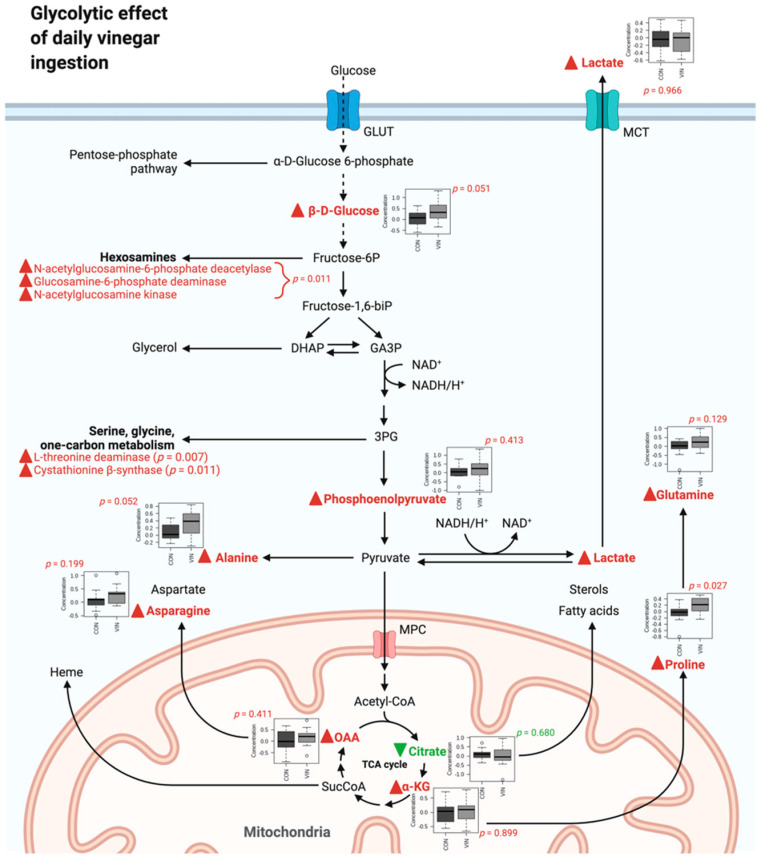
Figure 7.
Integrated hypothesis describing observed and predicted metabolic response to vinegar supplementation. The conceptual schema was constructed using results of univariate significance testing, pathway enrichment analysis, and enzyme enrichment analysis. Green lettering with downward green arrows denote decreases in the VIN group, while red lettering and upward red arrows denote increases in the VIN group. Created with BioRender.com.

