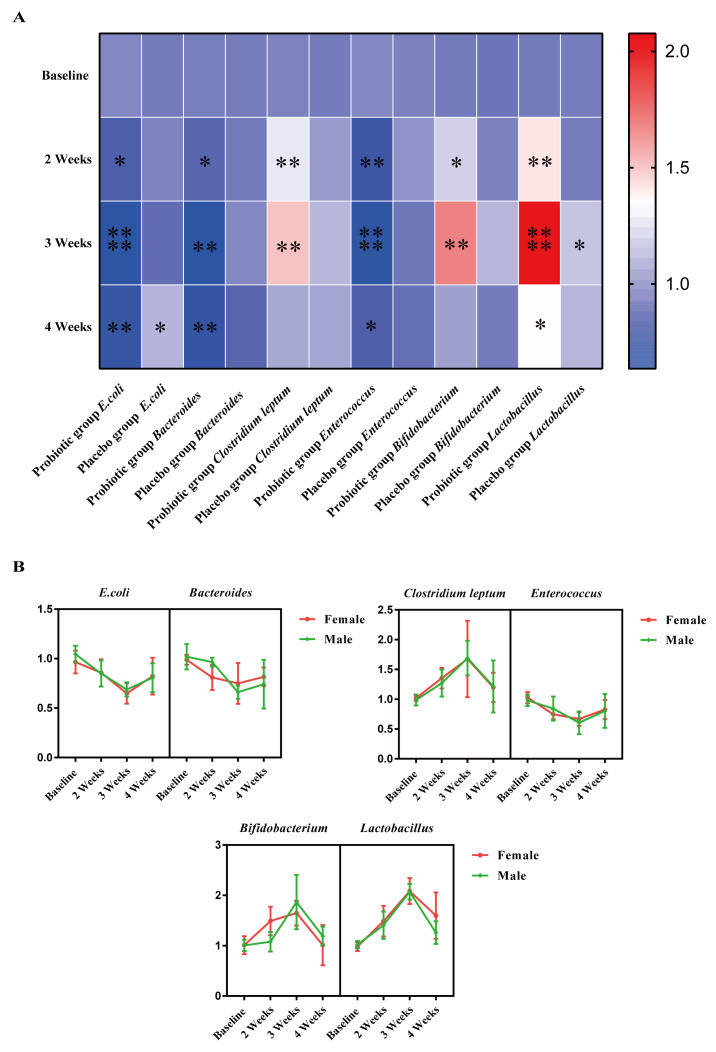
Figure 4.
Relative expression of fecal flora in volunteers. (A) Relative expression levels of 6 species of bacteria in the feces of volunteers (B) Relative expression levels of 6 species of bacteria in the feces of volunteers in the probiotics group. Colors ranging from blue to red indicate low to high expression. Asterisks indicate significant differences (paired t-test, compared with baseline value * p < 0.05, ** p < 0.01, **** p < 0.0001). n = 10 or n = 5 volunteers per group.

